The Watch List page allows you to compare many data points at the same time in a table view. Powerful query and parameter based watch lists can be built using the Watch List Builder, and later viewed on the this page.
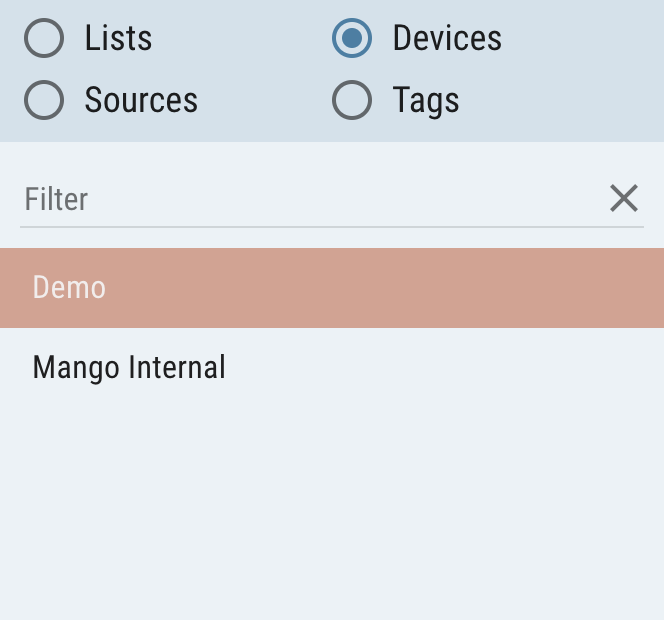
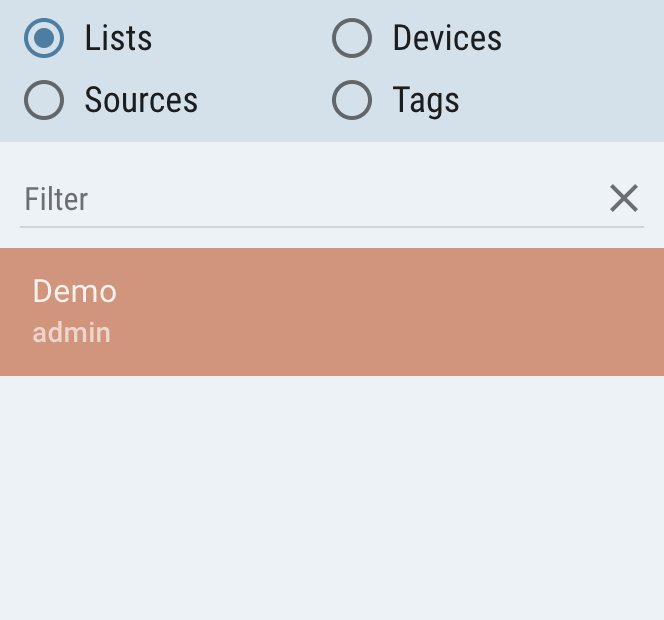
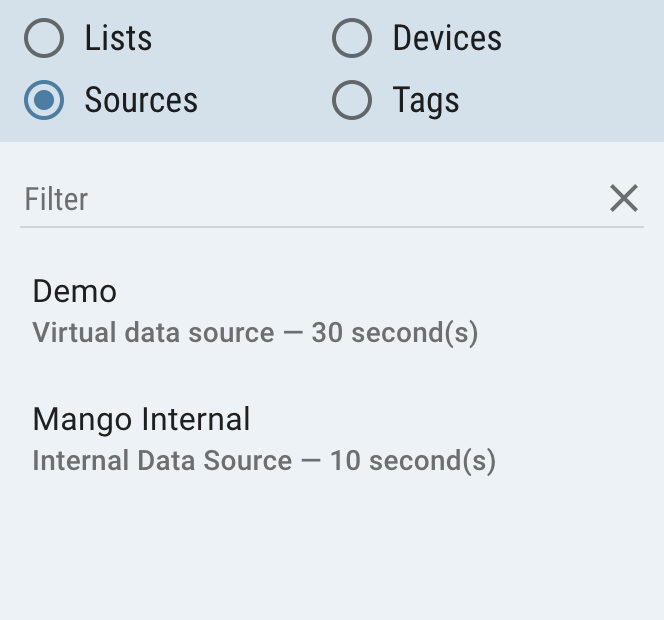
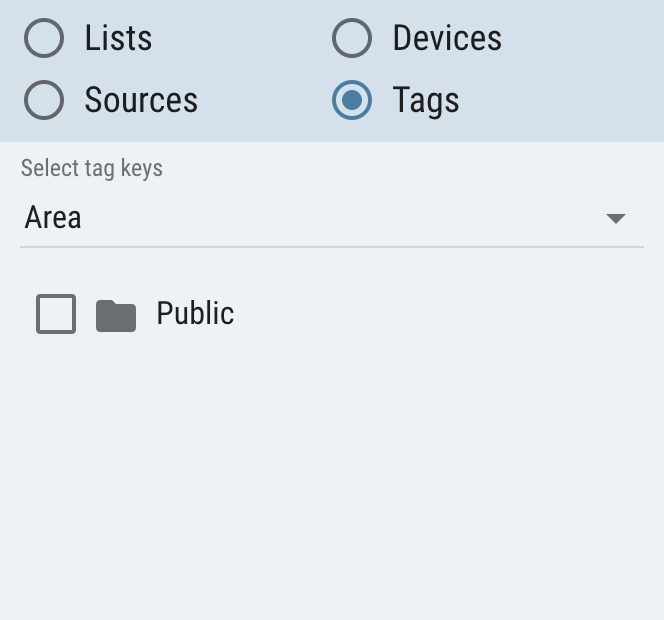
On the left side of the Watch List page you can choose between custom Lists, Devices, Sources or directly from folders of the point Hierarchy. Choosing a new list will clear the chart and load the new points contained within that list into the table view. Each type of list is explained below:
- Lists - A custom list of points that can be generated using the Watch List Builder. Lists can be generated that are dynamic and based on query parameters.
- Devices - An arbitrary group assigned to data points often used to refer to a machine name. Every data point has a single arbitrary device name, which can be edited while editing the point.
- Sources - A "place" from which data is received. Data points must be created on data sources. Every data point has exactly one data source.
- Tags - Tags are used to group data points in much more flexible way, and it their are a replacement of hierarchy points.
if the watchlist is not created, you can click Save, and you will be linked to the Watch List Builder page to create a new watchlist with the configuration that you selected.
Watch List Table
All column names in the Watch List Table can be clicked to sort ascending or descending by the selected field. Point values will flash with the live value as they update in real-time.
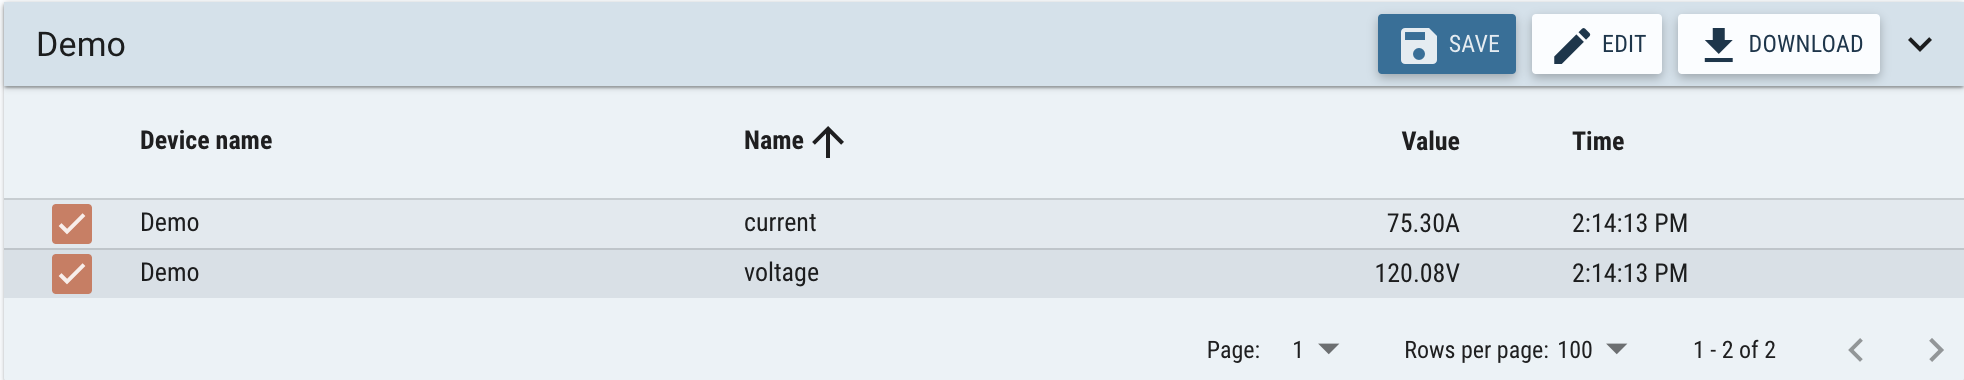
If the viewed list is a List Type Watch List, you can click the edit button to open the Watch List Builder page and edit the configuration for the selected Watch List.
Downloading Data
You can export data from a Watch List by clicking the Download button.
This will open the Download point values popup which gives you options to Download data for checked points only or Download data for all points on watch list. You can also set Rollup type and choose to use CSV or JSON for the exported format.
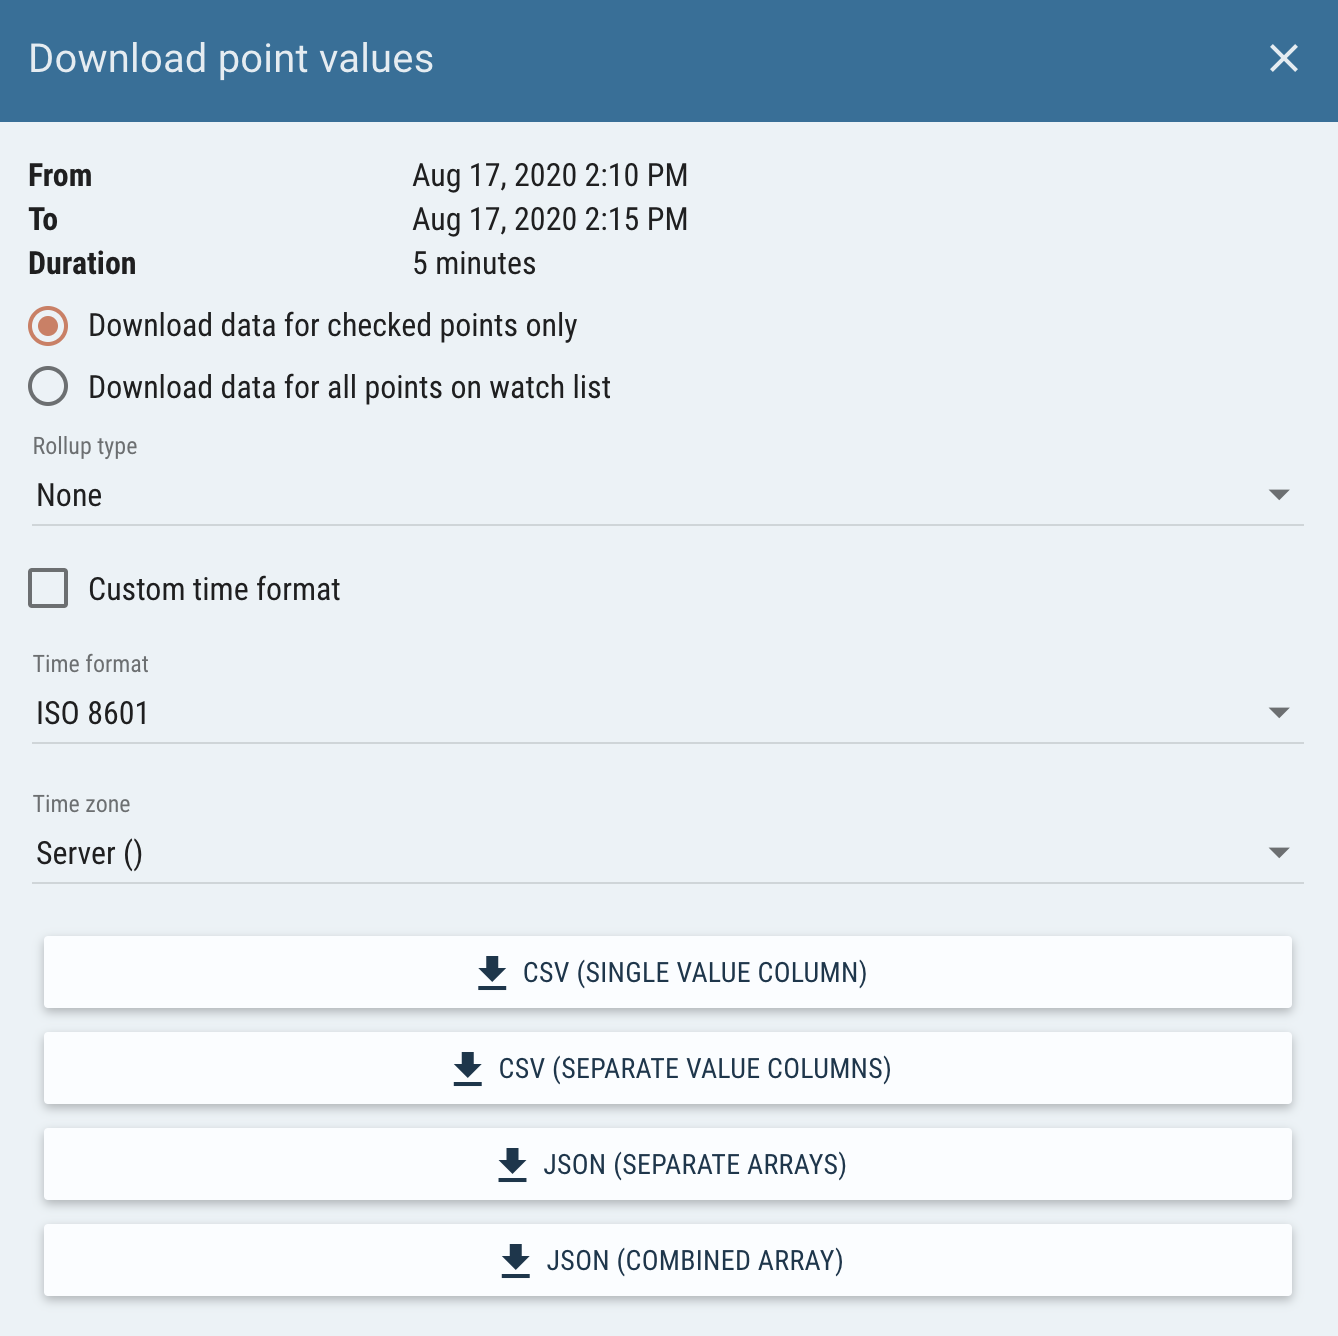
Chart and Compare
You can click the checkbox on the far left of each row in the Watch List Table to add a data point to the Chart and Compare pane.
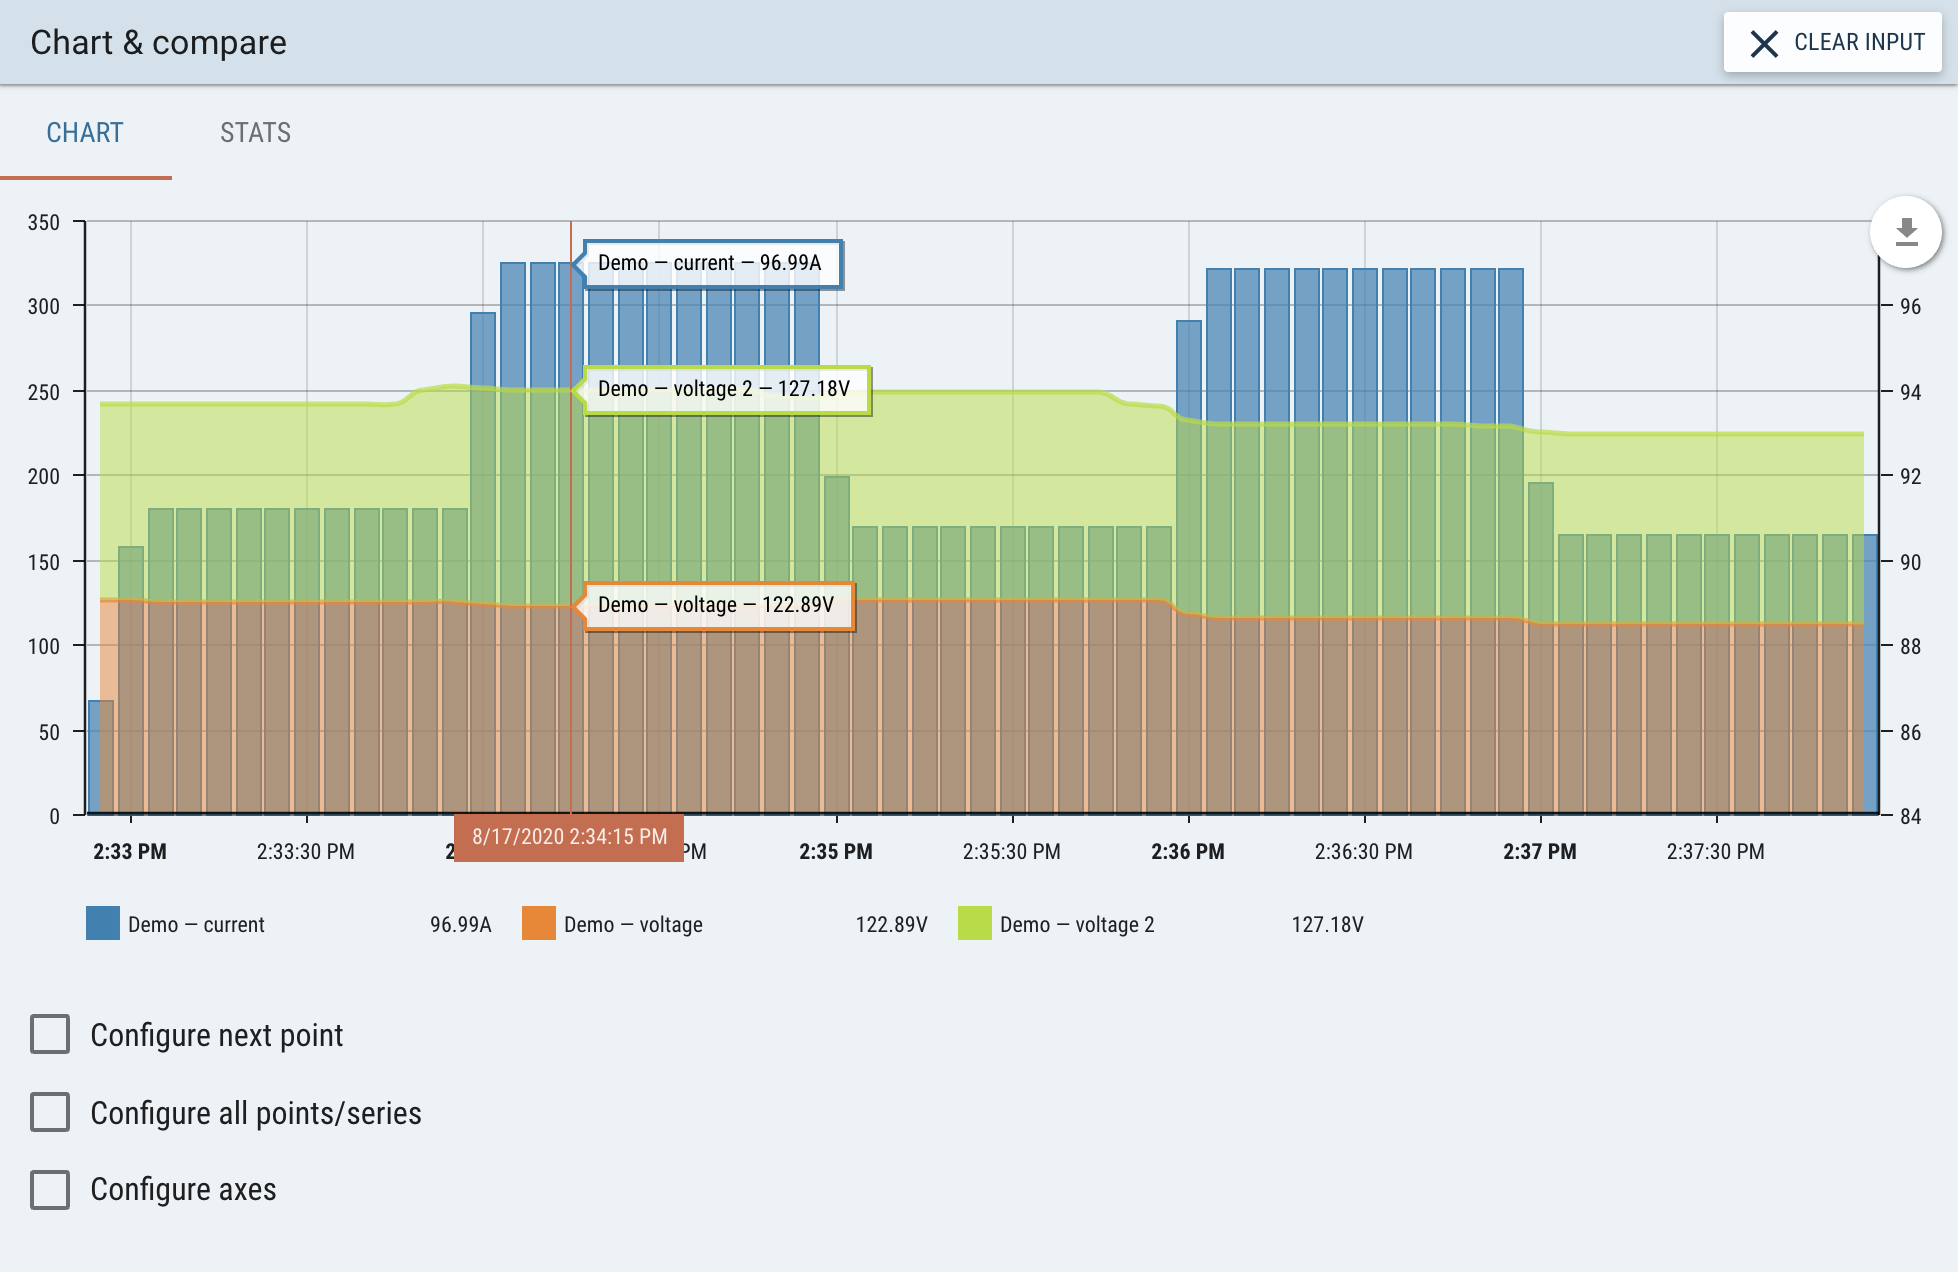
The date range in the Header Bar controls the time period displayed in the Chart and Compare pane.

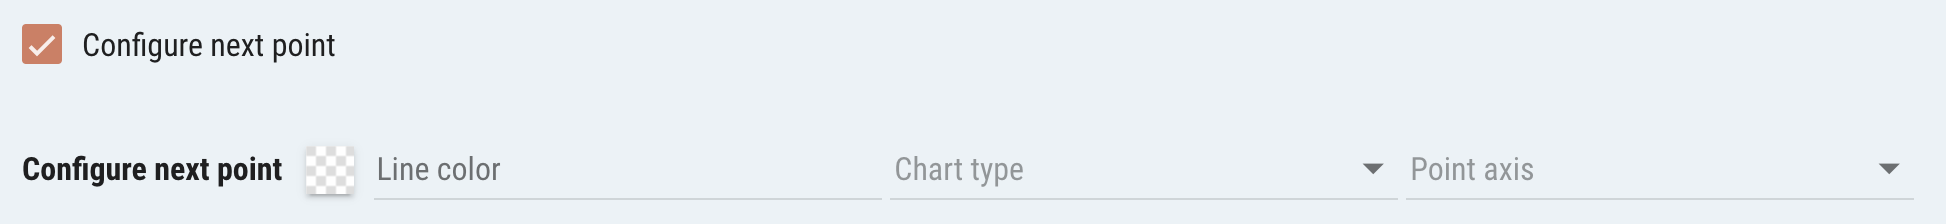
By default a point will be added to the chart using the the left axis and the line color set in the point’s properties. This can be changed by checking the Configure next point checkbox beneath the chart. This allows you to set the Line color, Chart type, and Point axis for the next point added to the chart.
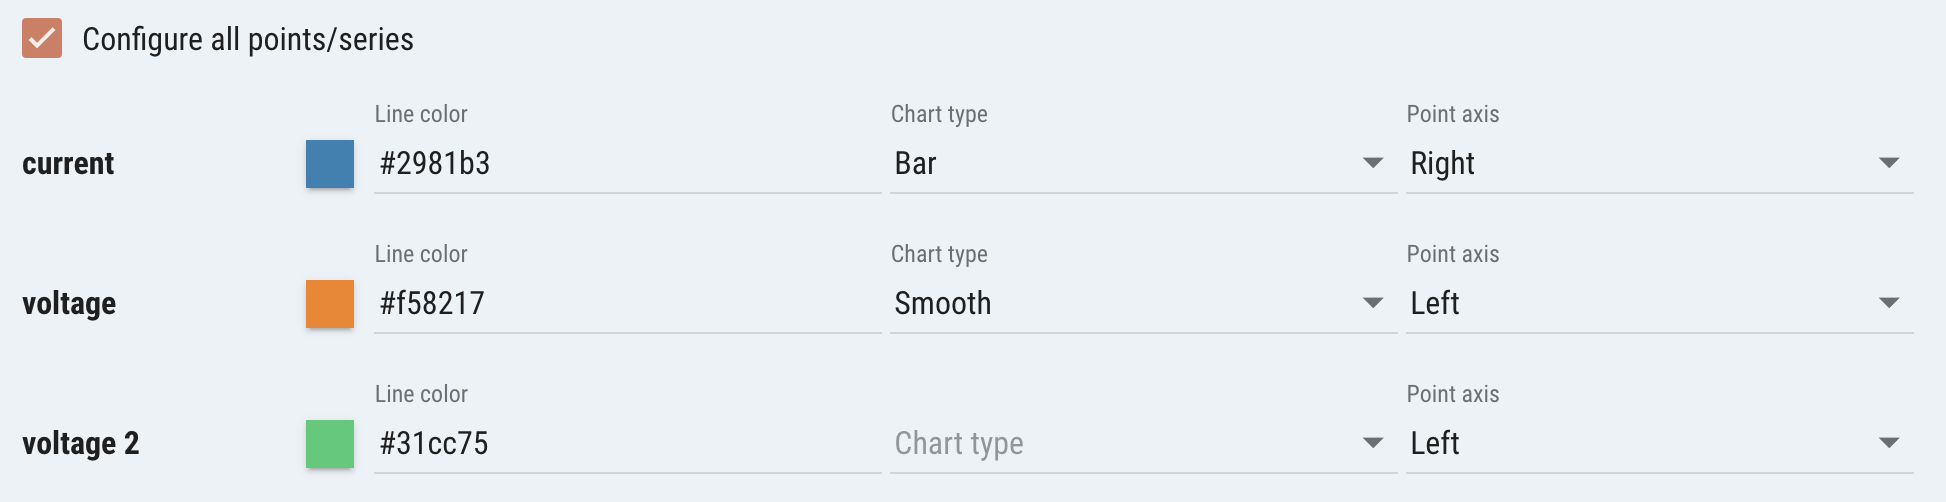
Using the Configure all points/series options you can set these same properties for data points that have already been added to the chart.
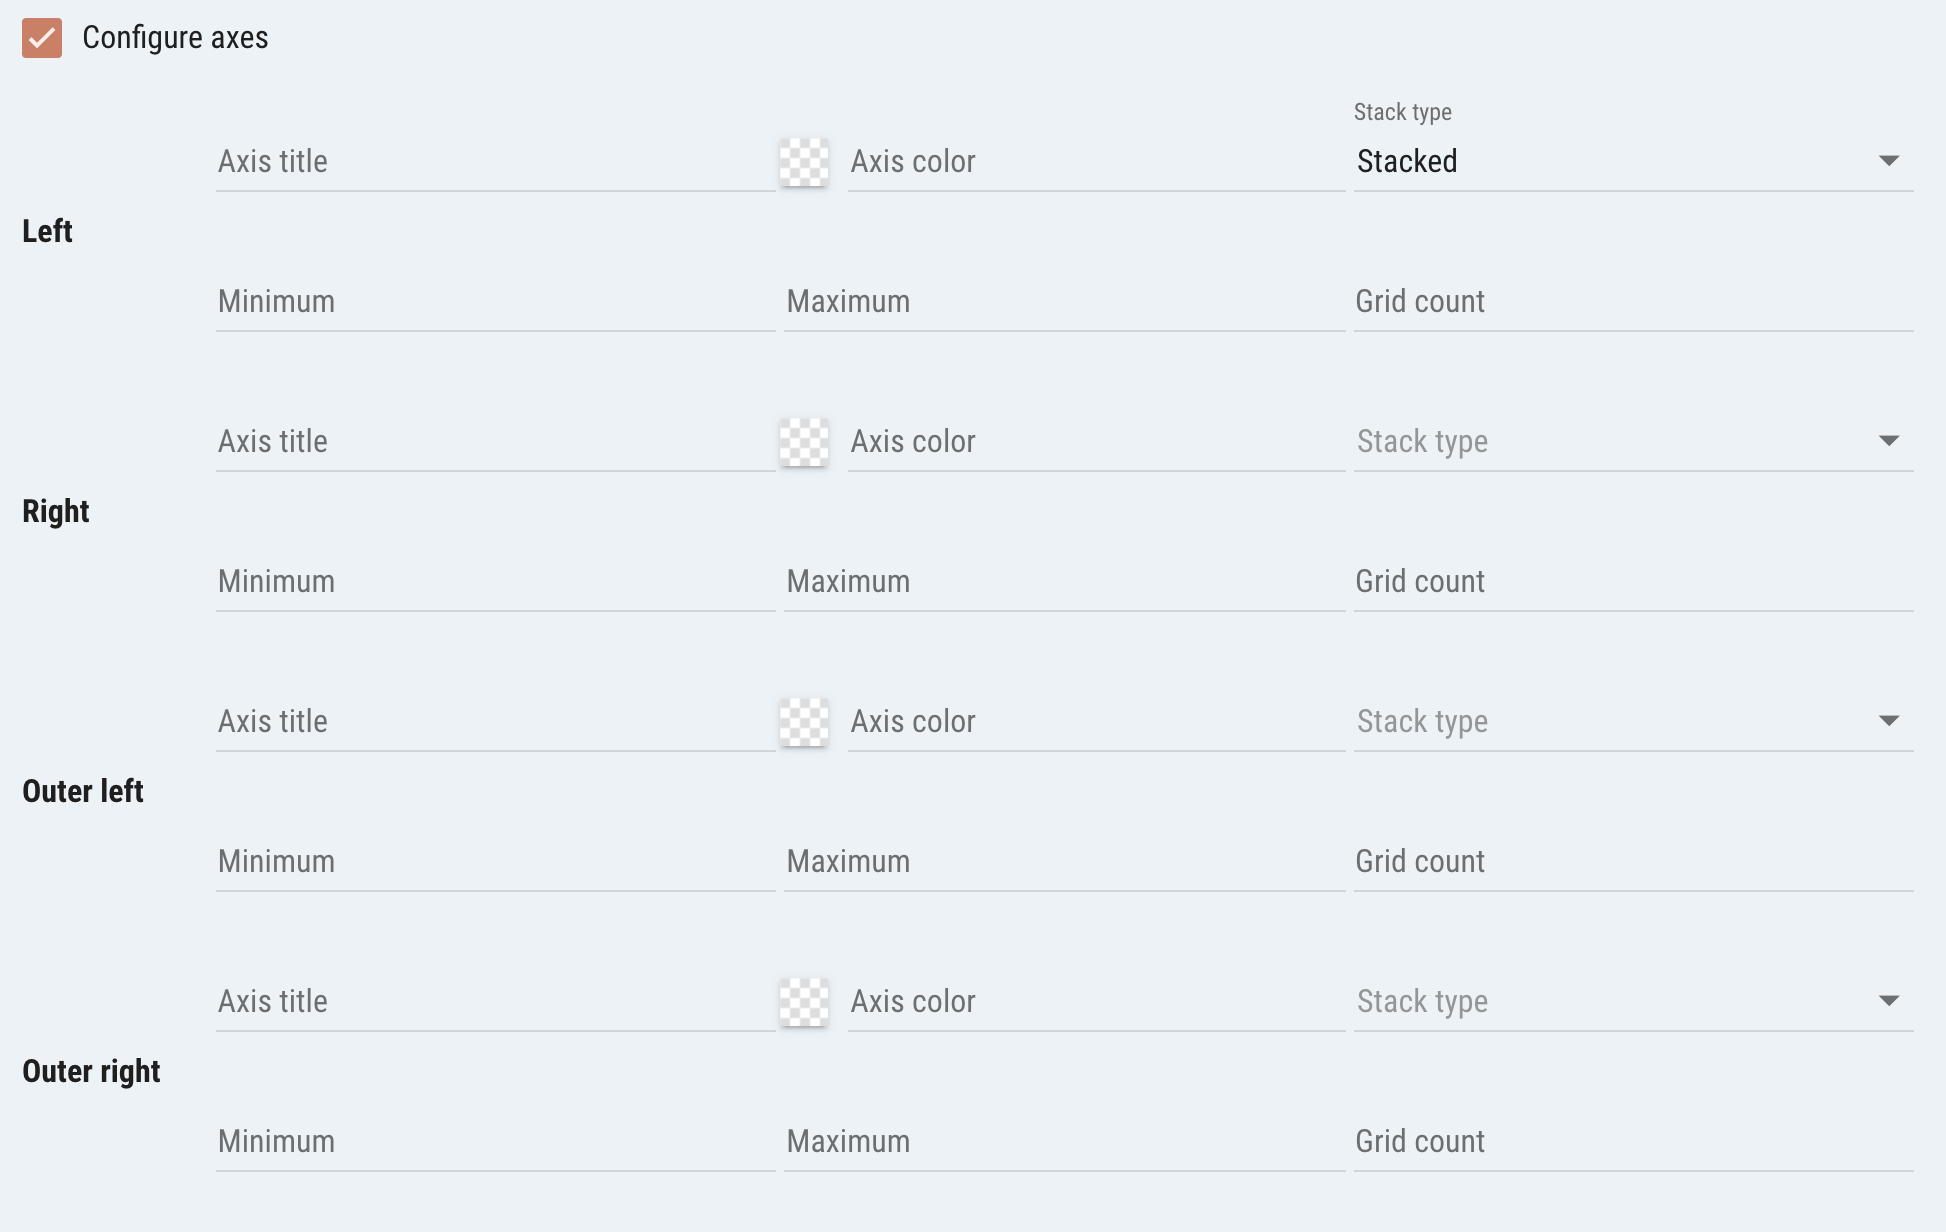
You can also set Axis Color and Stack type for the four available y-axes that data points can be assigned to. It can be useful to split up data points that will fit into a similar value range on the y-axes of the chart. Stack type can be used to create filled area charts that stack with the combined values of multiple data points, or to a 100% Stacked type to show show relative proportions.
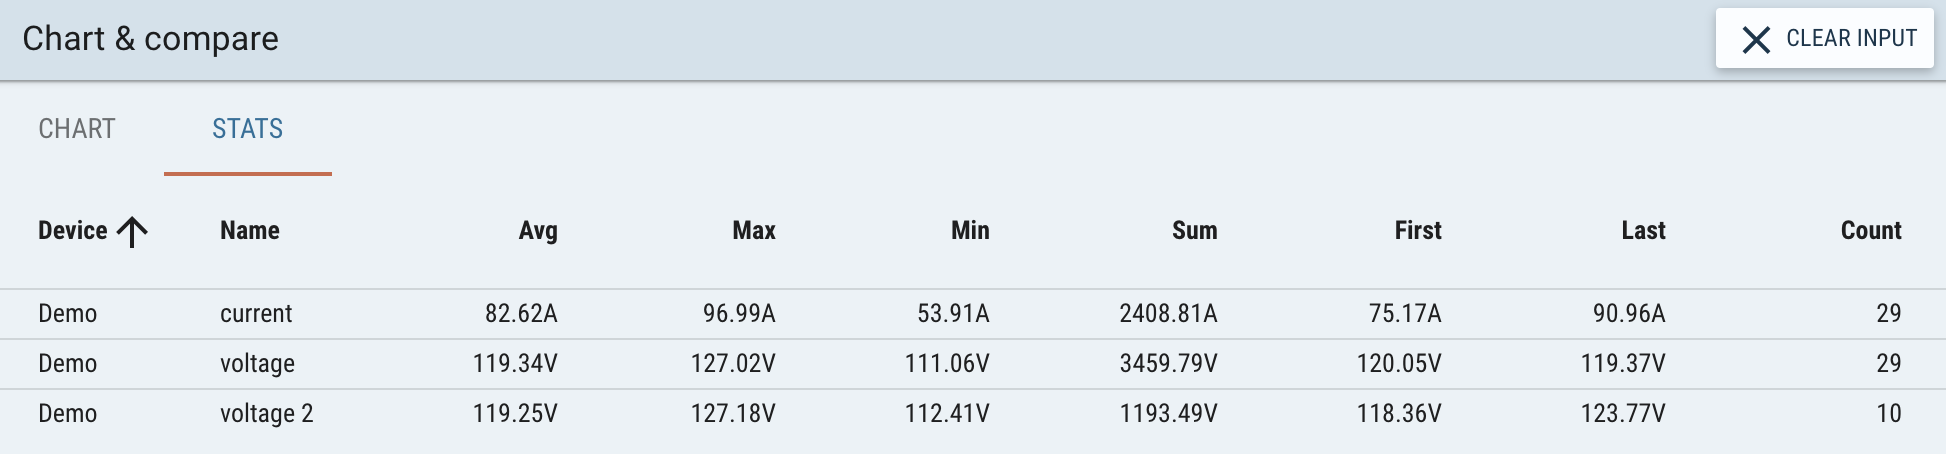
Once added to the chart you can also click the Stats tab to view a comparison of statistics over the selected time range in the Header Bar.
Note that any modifications to which points are checked to display on the chart, as well as chart config options will need to be saved with the Save button to persist.