NOTE: The video above show the legacy user interface for the Excel Reports module. This has been updated in Mango into the new HTML5 user interface. Although the features are the same it looks quite different than what is shown in the video.
Mango has an Excel Reports Module, which allows you to create reports from excel templates. Mango automatically insert data in the template and deliver as an email or as a download.
You can access the Excel Report page under Administration > Excel Reports.
Use the help Icon in the upper right of the screen to learn more about the specific options.
When you click the New Template link, a report setup section will be showed.
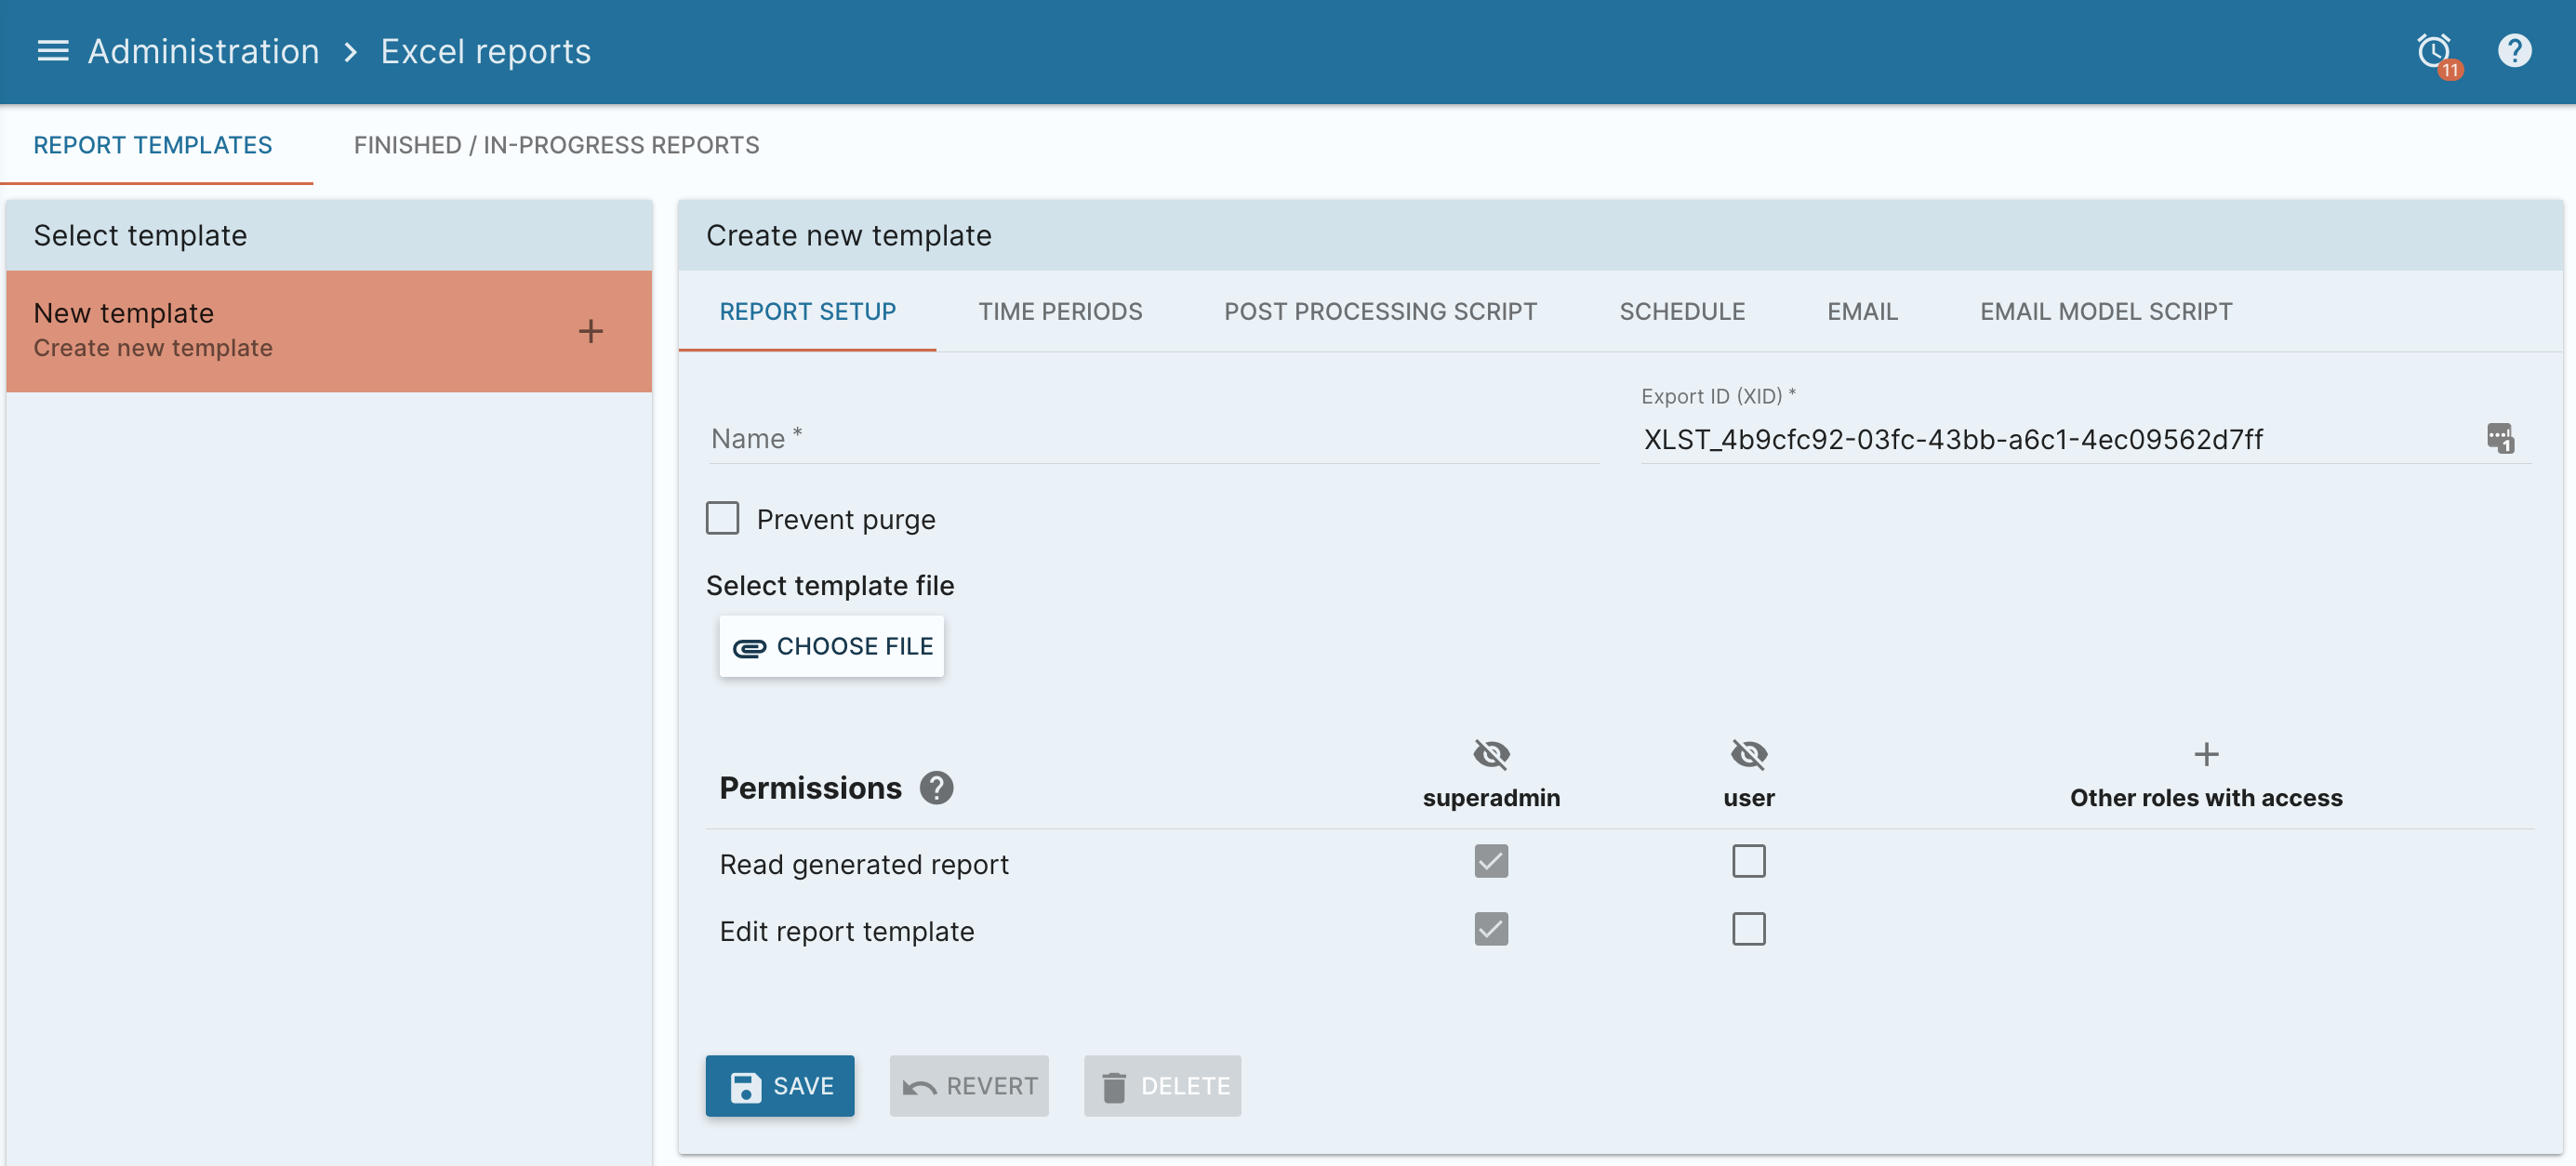
The template's name is used to visually reference the template. It is recommended that a unique name be used for each report, but it is not required. The report template's name will be used as the name for all generated reports.
Template is the Excel file that will be used to determine the available named ranges that will be filled in with data by Mango.
Prevent purge setting will prevent any generated reports from being purged.
Edit permission is a list of user groups that define which users can edit this template.
Report read permission is a list of user groups that define who can view any generated reports.
Time Periods
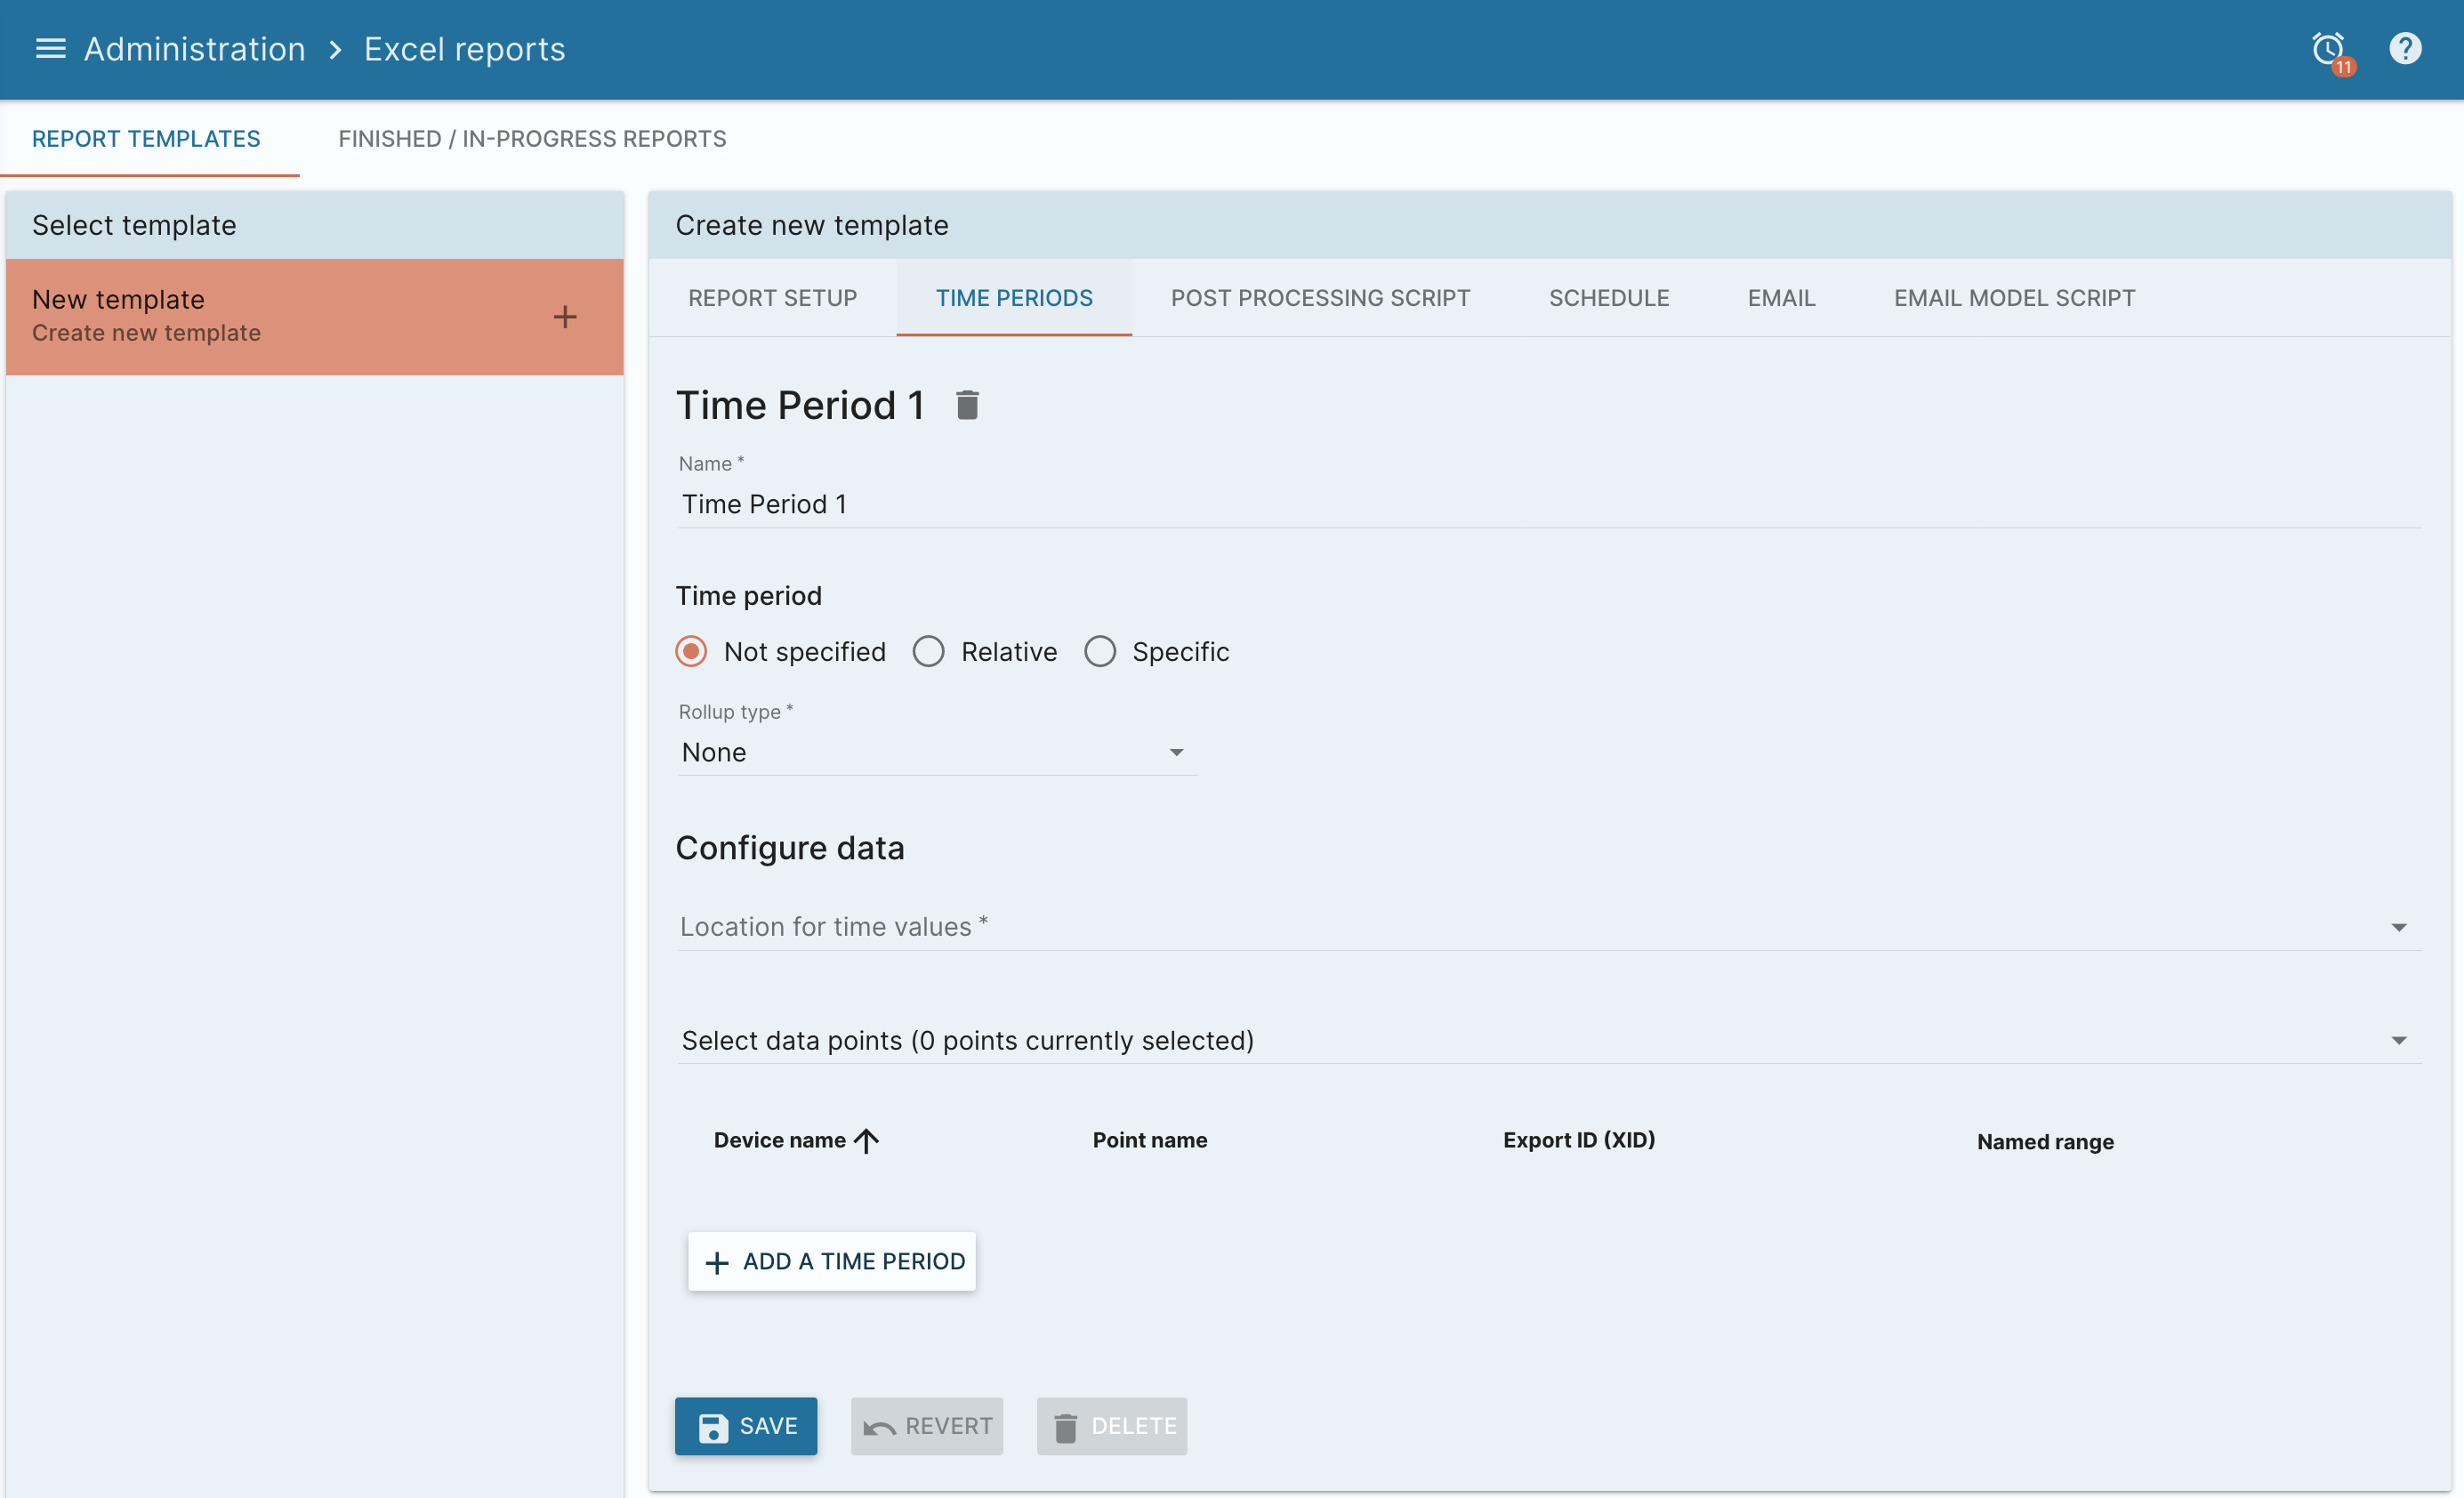
Time periods are groups of points linked to time ranges and rollups. Each time range will generate statistics and extract point values over this time range using the rollup (if provided).
Name each time period is given a name to help identify it on the Run now popup.
The Time Period is used to determine what values to select for the report. The range can be relative or absolute. In most cases a relative range is appropriate. Relative date ranges can be either based upon "previous" data or "past" data.
A Past range includes the given time period ending now.
A Previous range also includes the given time period, but its end time is quantized to correspond to the period type.
For example, if the period type is "Hour(s)" and number of periods is 1, and the report runs at 18:05, the time span that will be used is from 17:00 (inclusive) to 18:00 (exclusive). If the number of periods were, say, 3, the time span would be from 15:00 to 18:00. Similarly, "Month(s)" starts the time span at midnight on the first day of the previous month and ends it on the last day of the previous month (when the number of periods is 1). Other period types work the same. A week starts on Monday at midnight in accordance with ISO standards.
A Current range quantizes the time to the start of the selected period type until the moment the report is run.
An Ago range quantizes the time to the start of the selected period which is that many periods ago and quantizes the to the end of that period.
So for example you can query on the entire month that was 2 months ago, so if today is in January 2 months ago would be the entire month of November last year.
The Rollup is a way to group point data into discrete intervals. This is useful for many purposes including reducing the amount of data that the report will generate
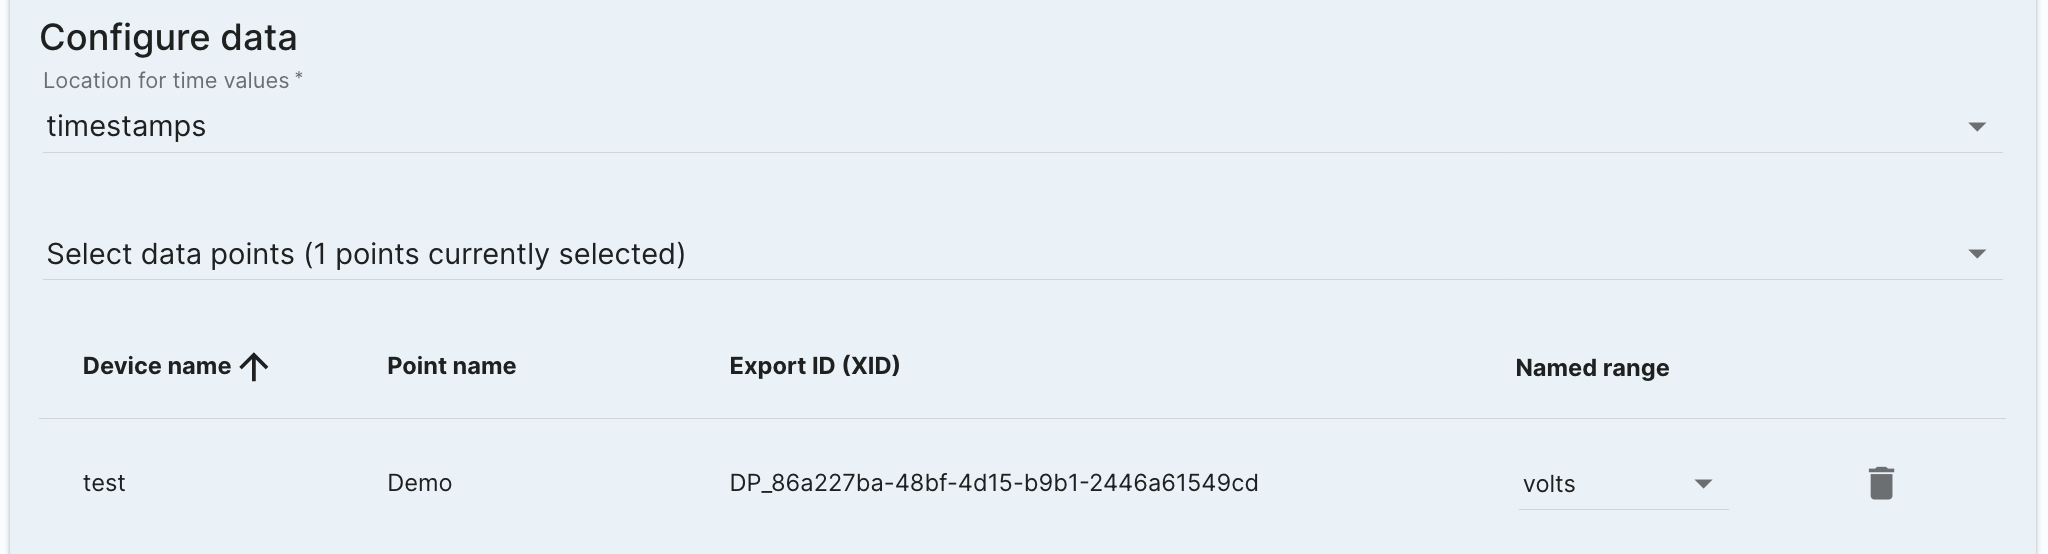
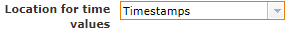
Location for time values is the named range into which the timestamps will be placed. This range must be a group of contiguous cells (ie. part of a column or row). Mango will expand or reduce this named range to fit all the data for the report. This is not required and if not present no timestamps will be inserted into the spreadsheet.
When you Add a point the point will appear in the table for that time range. (If Add to all time periods is checked the point will end up in all created time periods). After adding the point the named range must be set. This range must be a contiguous set of cells (ie. part of a row or column). It is worth noting that additional ranges can be created based on the assigned range. For example assigning the range: 'last_month_voltage' to a point in a Time Series will make the statistics for that point available in any ranges defined like 'last_month_voltage.average' or 'last_month_voltage.sum' See the Excel Template File setup help for more information.
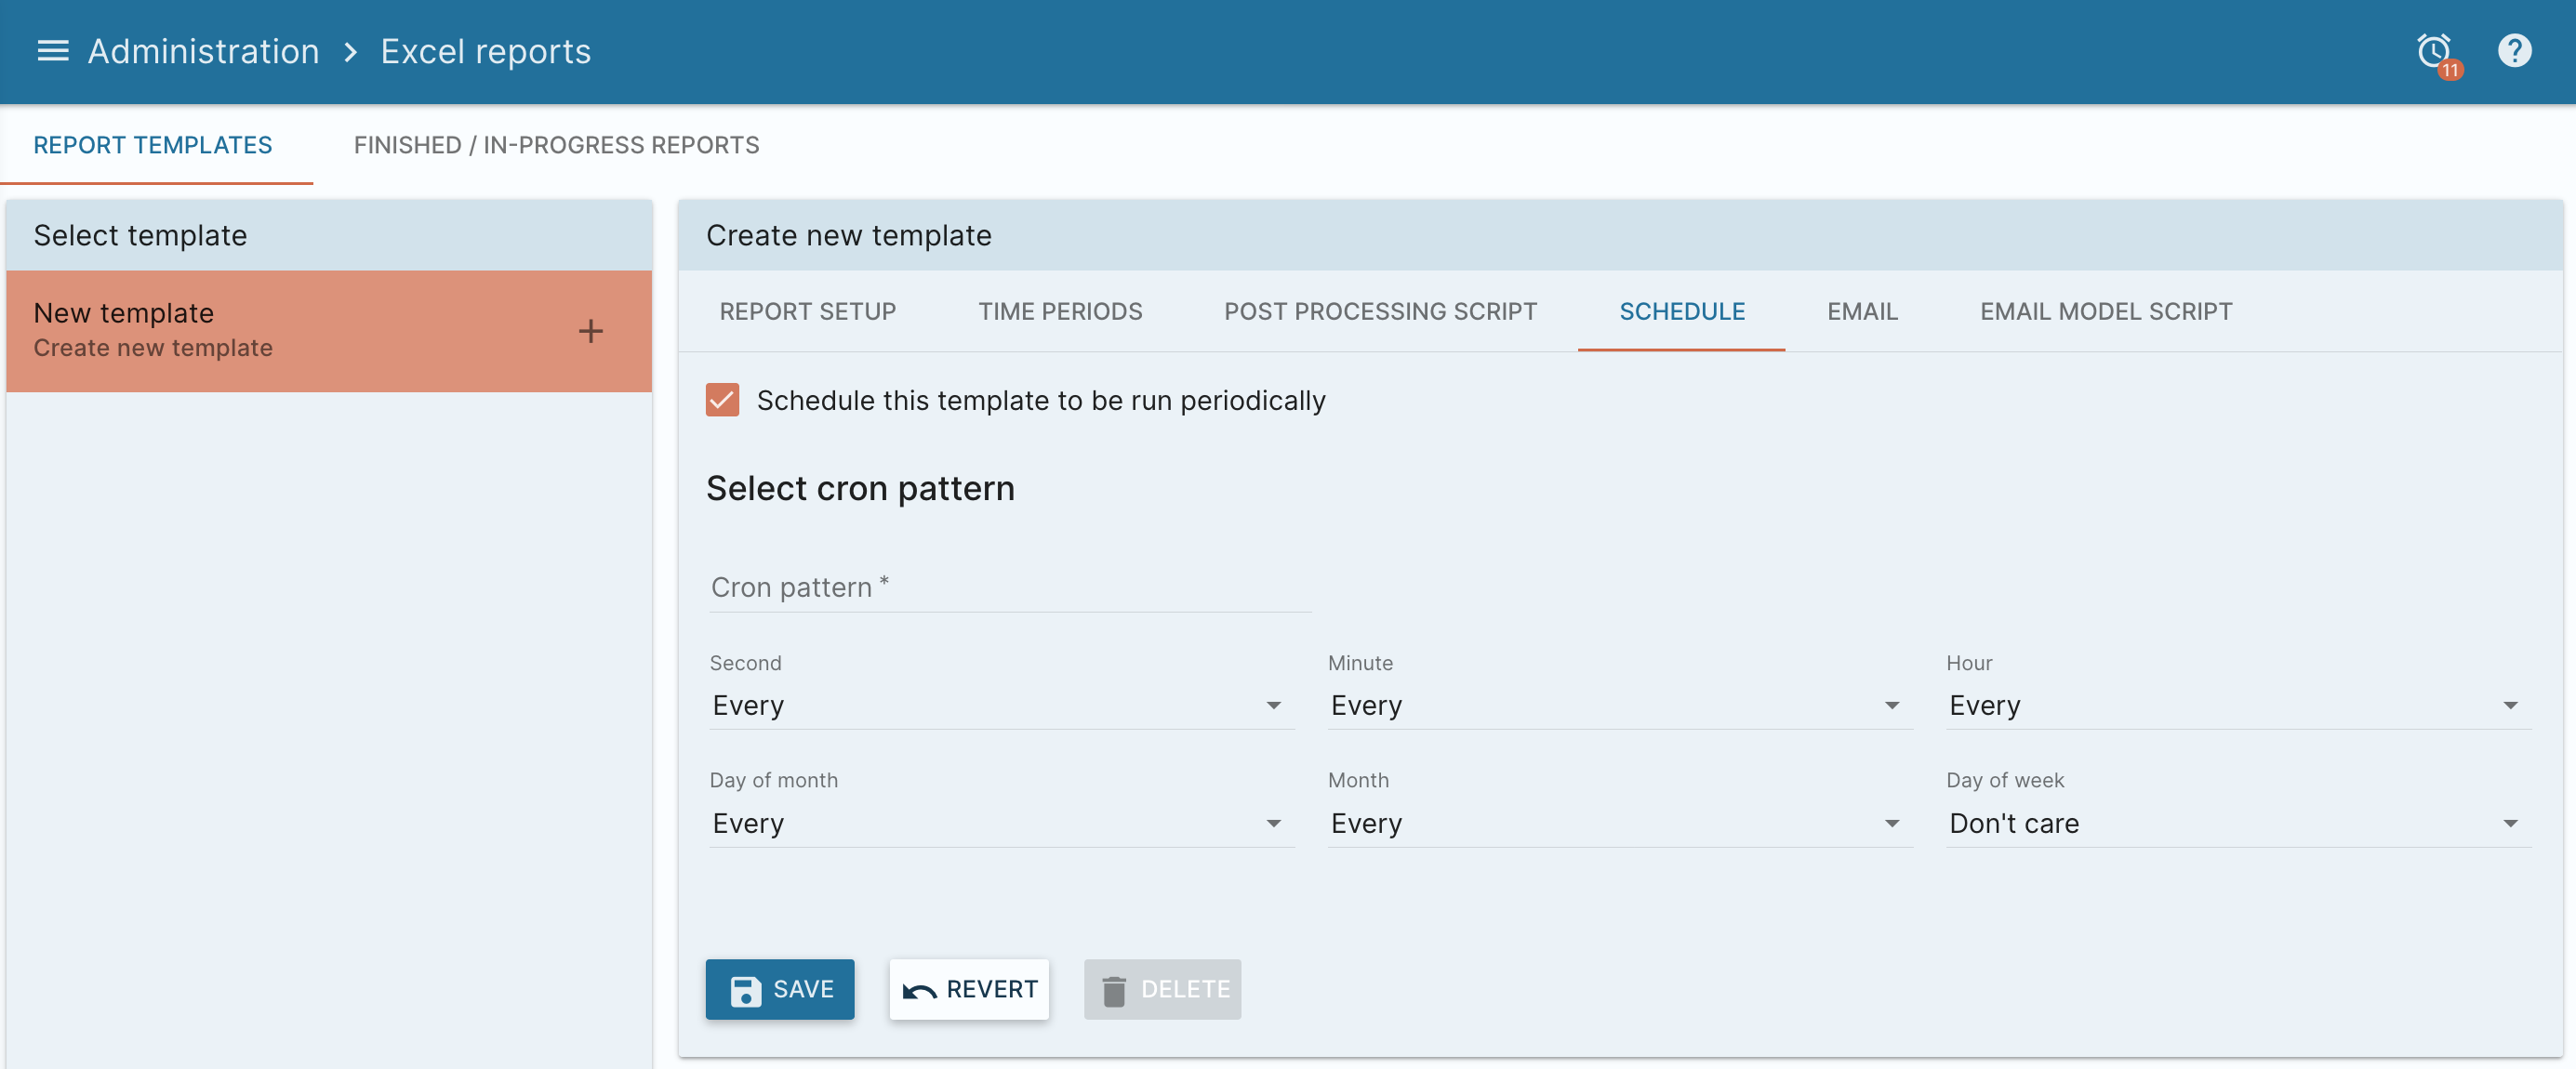
Report scheduling
Reports can be scheduled to run automatically. Enter a custom Cron expression or use the Cron builder tool to generate the appropriate pattern.
Scheduled reports for disabled users do not run.
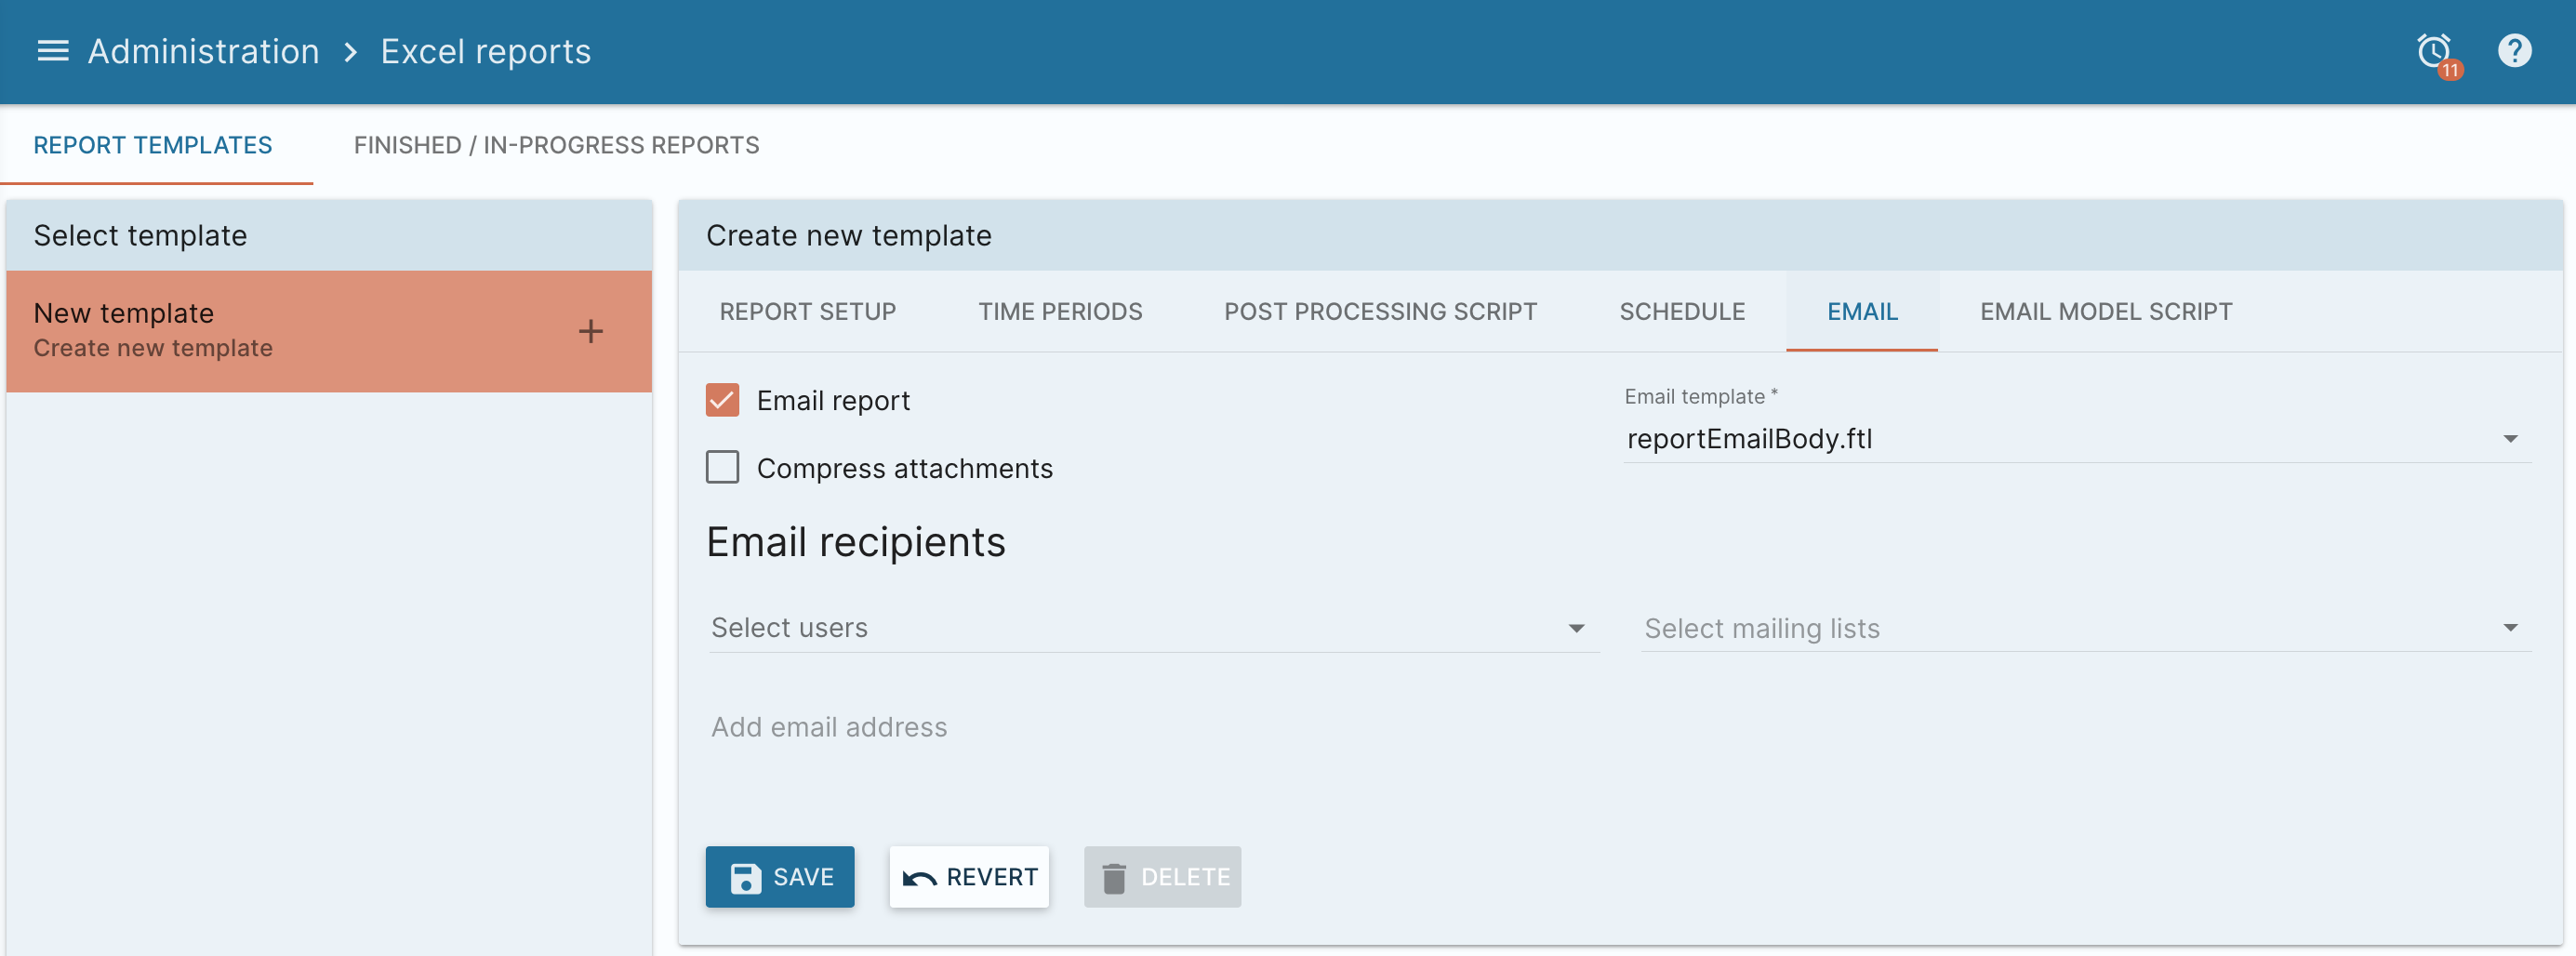
Report emailing
Reports can be emailed and will contain the generated Excel file (optionally compressed).
Select the Email recipients to which to send the report email. Recipients can be mailing lists, system users, or free-form email addresses.
Email Templates
Email templates are user defined Freemarker templates. These templates can be customized by using the provided template as an example. Any templates placed in the module's web/ftl directory will show up in the Template drop down list.
Excel Templates
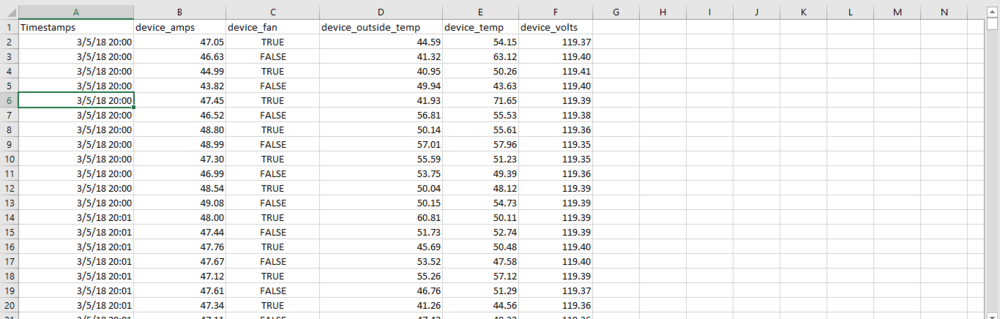
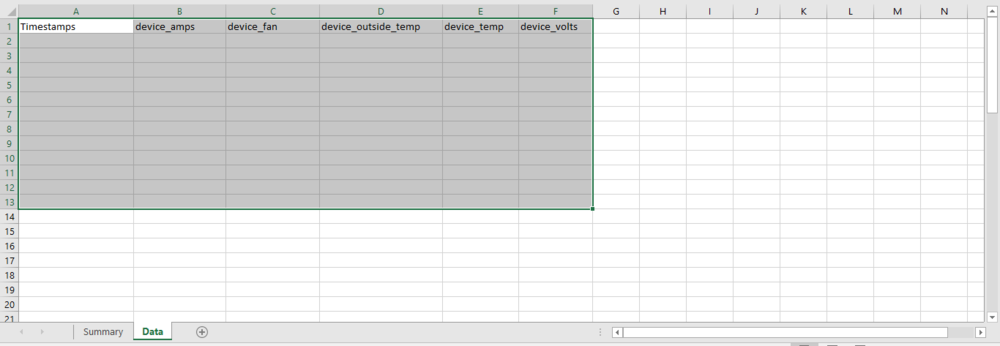
To create a template in Excel, you need to create a table which will contains the data points values. They will be related by named range.
To create the named ranges in excel you need to select the group of cells related to this variables.
Then, go to Formulas > Create from selection
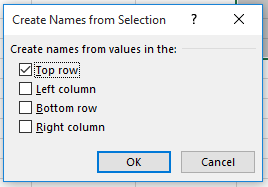
A popup window will be showed, now select Top row to create named ranges from the header rows and click OK. You can check the named ranges clicking on Name box select box and it will show a list of the named ranges created.
Remember that you need to create a named range for the timestamps and this will be related to Location for time values variable.
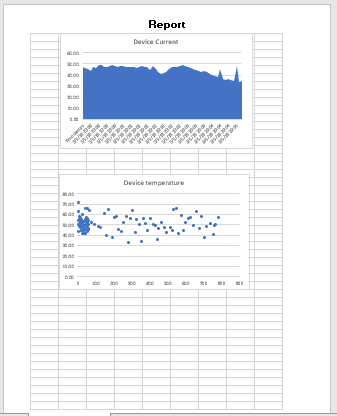
In another Excel sheet, you can create your custom reports using this named ranges as incoming data.
Once you save the report, you can do the next options:
Copy Report
This will load in the settings from the previous template and allow you to save the new copy. The copy must be saved before it becomes a new template.
Delete Report
Delete a report by clicking the icon.
Run Report
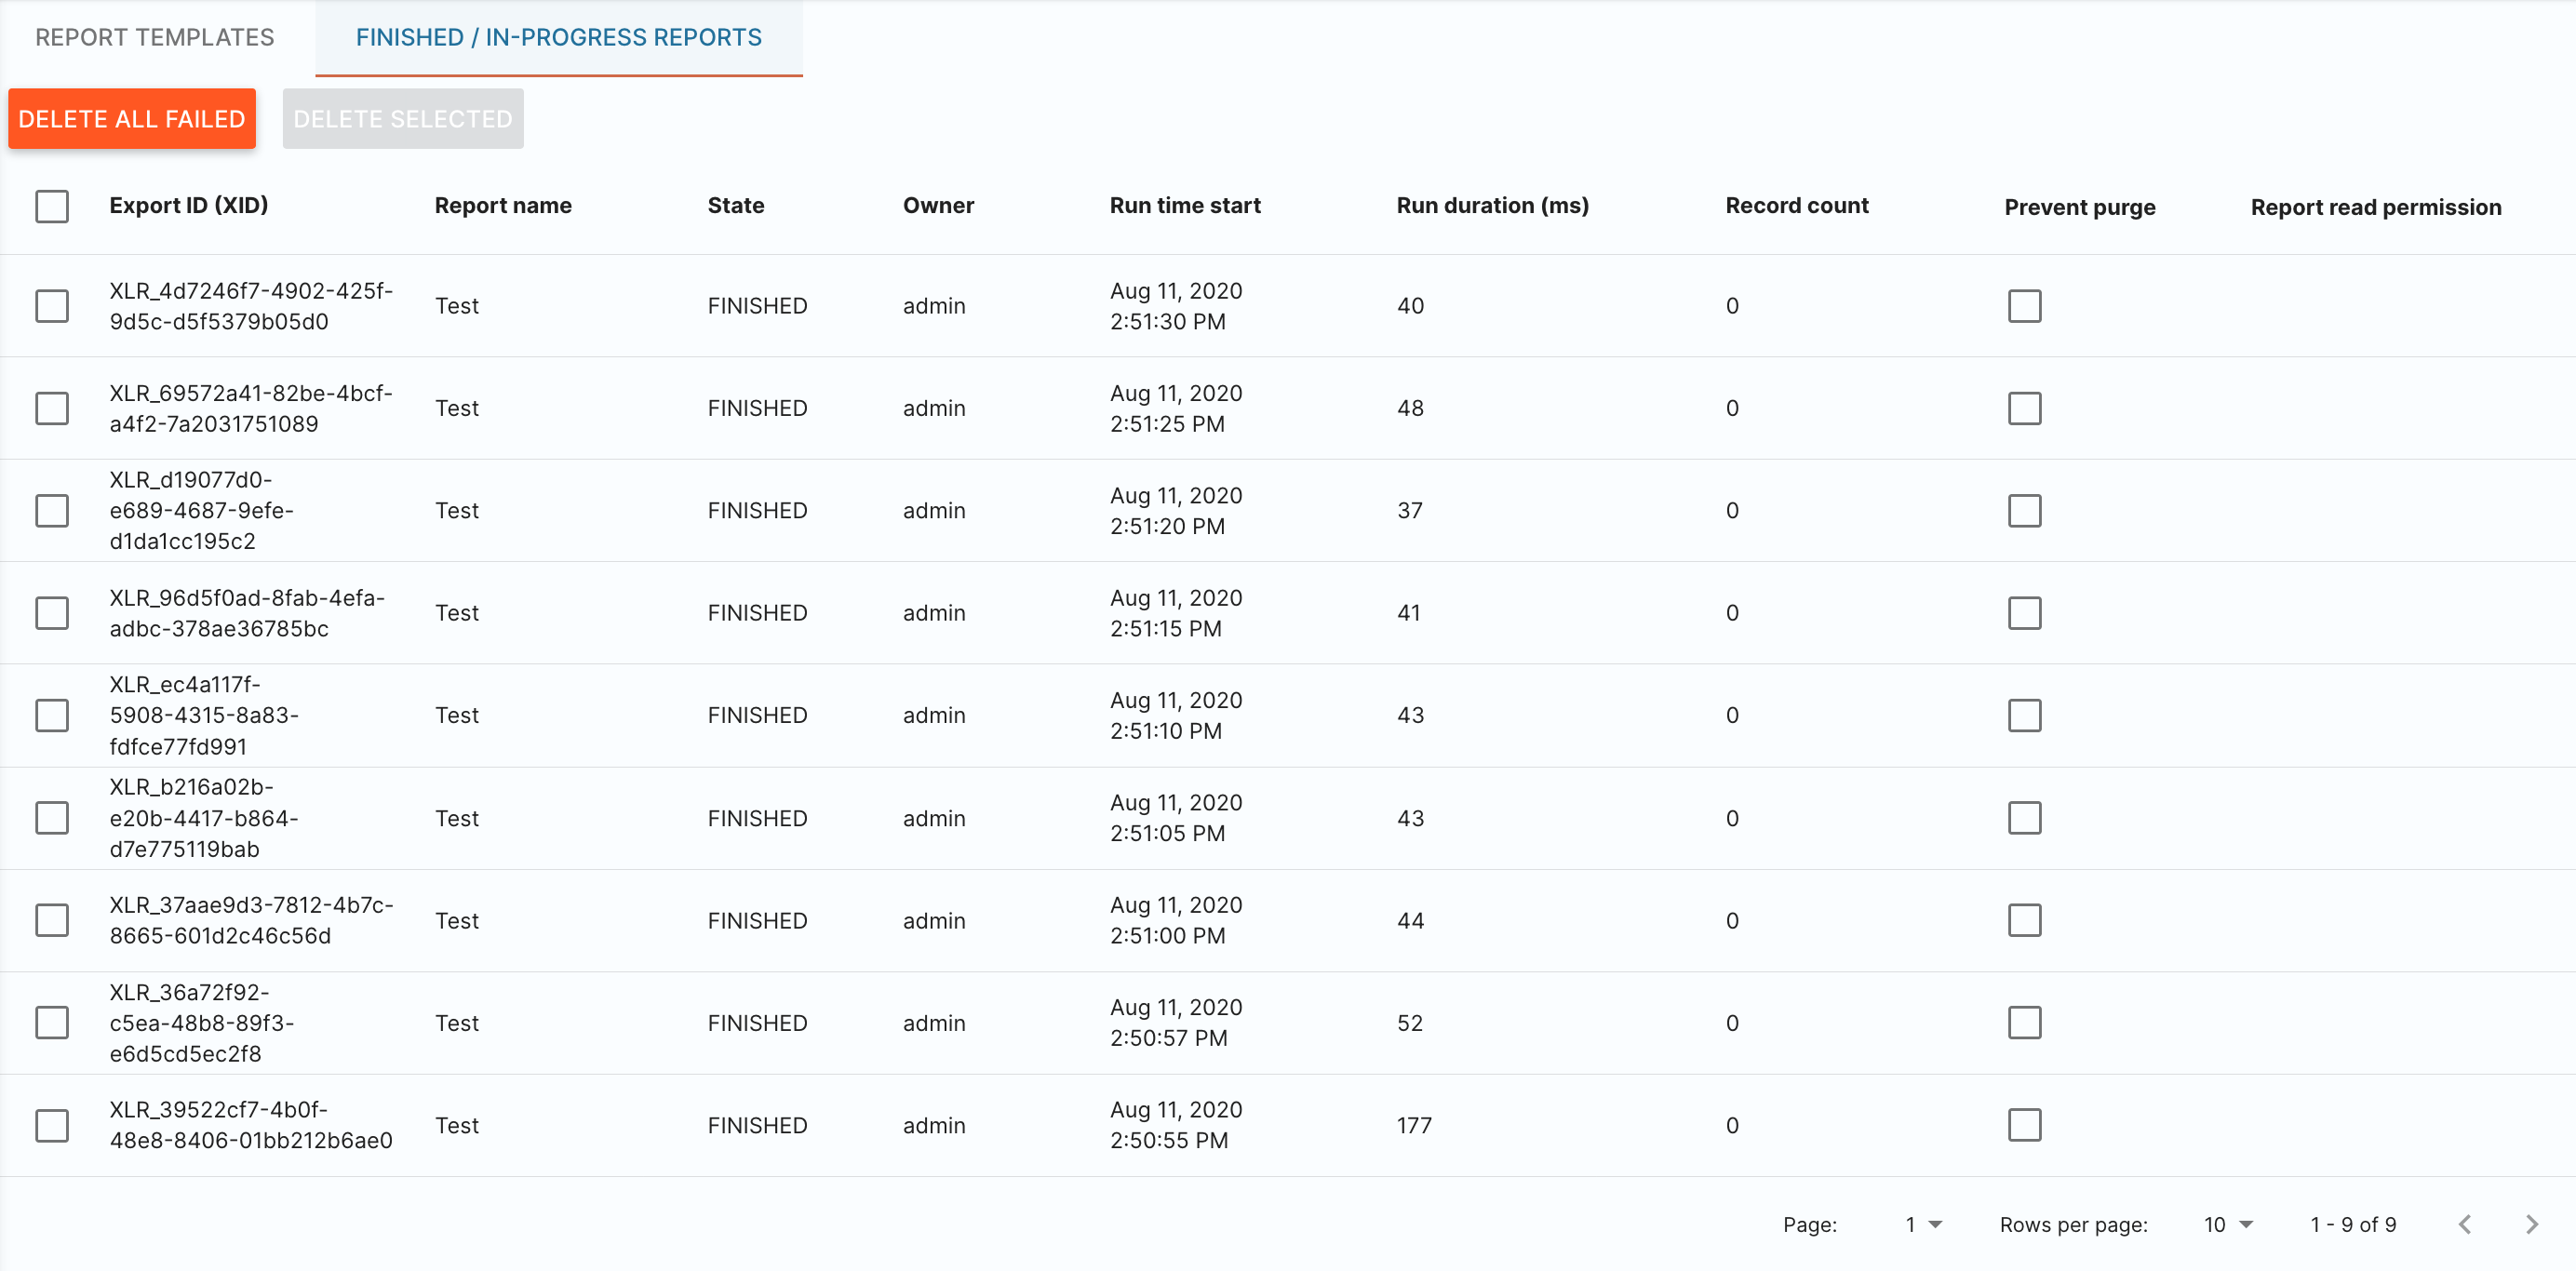
This will immediately schedule a new report. The status of the new report will be shown in the Finished / in-progress reports table. The report will be run in the background and when finished be available for viewing.
Run With Specific Dates
Run a report and override its date settings. This will pop up a window to enter date ranges prior to scheduling the new report. The status of the new report will be shown in the Finished / in-progress reports table.
Once you run a report, you will be able to see a list of finished/in-progress reports.
If you download a report, you will see table of data filled with the data points values, and the custom report will adapt to the data.