View designing in Adobe Illustrator (AI)
To create a view with an animated SVG in the Mango software, you must start with the design of the view in Adobe Illustrator (AI), in order to have a vectorized, documented image and obtain a .svg file.
A vector graphic is represented in a basic XML language, which allows animating the drawing, through programming tools.
View sketching
The sketch of a view includes variables definition, graphic resources and the user experience (UX) that you want to develop.
Variables definition
Variables that will be displayed in the view has to be defined, for example, temperature, pressure, humidity, voltage, power factor, the status of actuators.
Also, you have to classify them by types of variables:
-
Binary
-
Multistate
-
Numeric
-
Alphanumeric
Graphics resources
The graphics resources to be used in the view are defined (images, icons, tooltips, graphs, tables, maps, among others).
User Experience
The user experience (UX) refers to the structure, graphic design, functionality and sequence of the views that will be developed, for example, the function of the buttons, the hover effects to be programmed, the elements distribution, etc.
Creation of SVGs in Adobe Illustrator
When developing the view sketch, it has to be identified which icons will be part of the view. In addition, the animation of the view sketched is established. For example, it is intended to create four electrical panels, the main panel which distributes energy to the lighting panel, HVAC panel and the miscellaneous panel of a pharmaceutical plant.
Electrical panel sketch for Electric Distribution View
We proceed to design the electrical panels and the elements they contain (energy meter, terminals, breakers, pushbuttons, gutters, wiring distribution, etc.)
The images functionality is established and the elements that will have animation on the panel (breaker status, real-time energy meter variables visualization, etc.)
Vector drawing construction
In the Adobe Illustrator (AI) work table, each of the elements that will be part of the view begins to be vectorized.
The vector drawing start can be a freehand or structured sketch. Also, you can start with a png or jpg image as a basis to create our model.
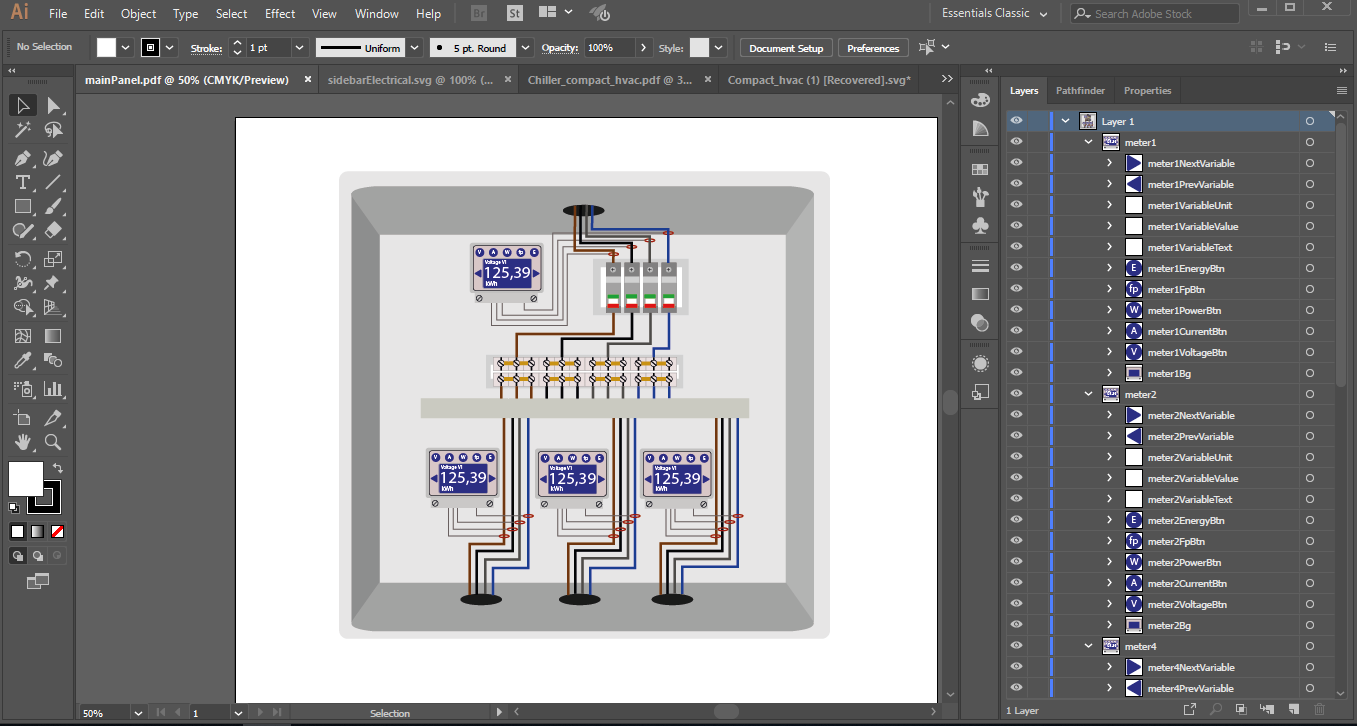
Take a look at the following image:

The main electrical panel design includes the previous construction of SVG, such as the energy meter, breakers, electric terminal block, current transformers (CT), conduit, wiring and the electrical panel.
In the design phase, the energy meter and the breakers will be animated in the view showing the status of binary and numerical variables of the electrical distribution system. For this reason, the current functionality of these electrical devices is considered in the design of the drawing.
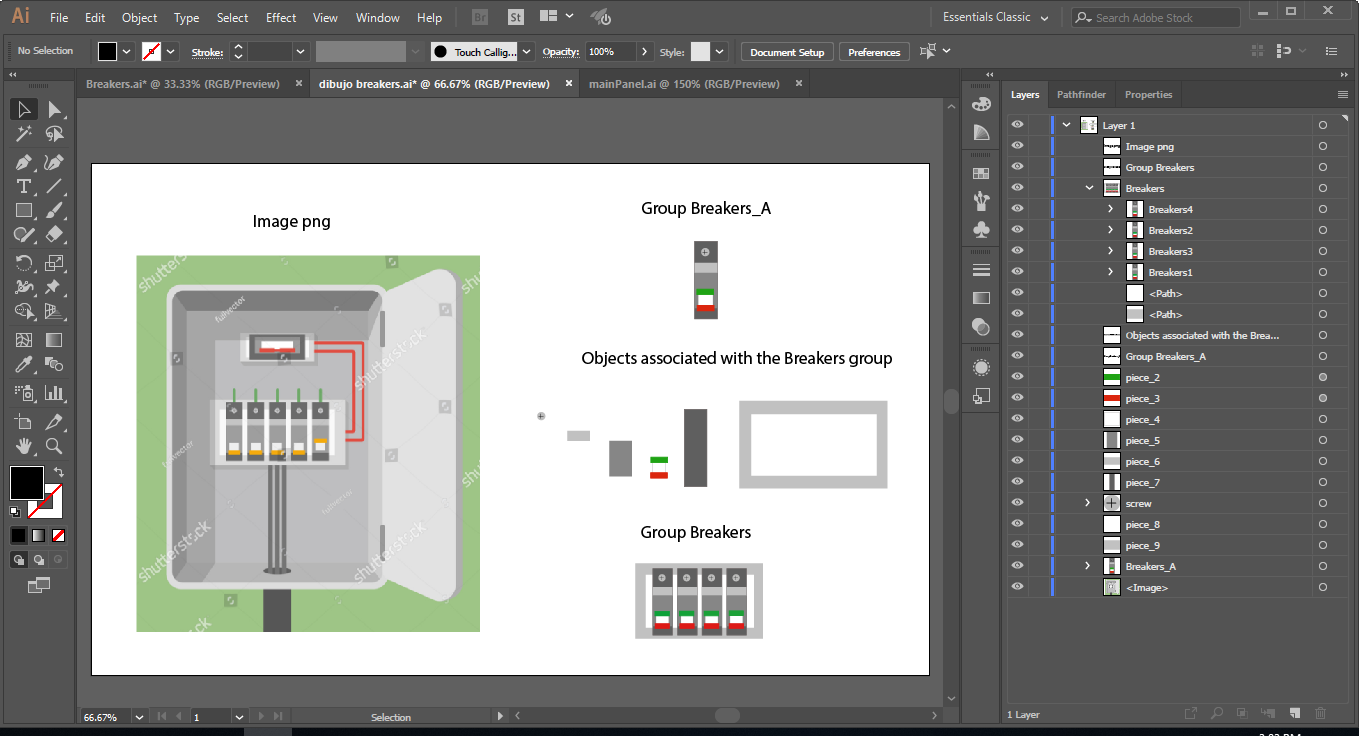
Initially, the Breaker object is designed, from a png image that is used as a basis for tracing. It should be noted that to create the Breakers object, tools such as Pen Tool, Rectangle Tool, Ellipse Tool, Line Segment Tool, Transparency (Opacity), Fill and Stroke are available. The following image shows the various objects created, to form the Breakers_A group and the Breakers group.
When we vectorized in XML format the image developed for the view, will be a .svg file.
SVG documentation
Each object created in the work table of AI represents an object, which is associated with layers, these layers must be identified, in order to generate a documented SVG. Also, it is necessary to group the layers, to create a general object, example: group 1: breakers 1, group 2: breakers 2, group 3: meter 1, group 4: meter 2, etc. Check in the following image:
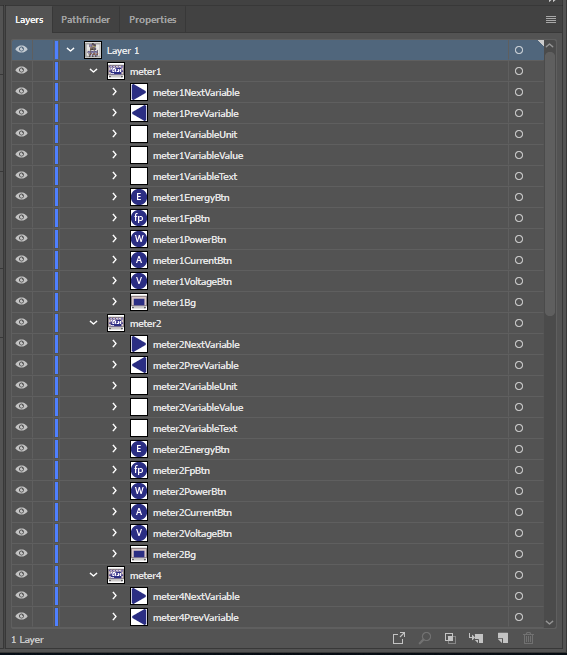
The identifications (ID) and groups in AI allow maintaining an order in the .svg file to be generated. In addition, it is useful to document the drawing that will be animated for the construction of the view.
Find attached a video that shows how you can create a view.