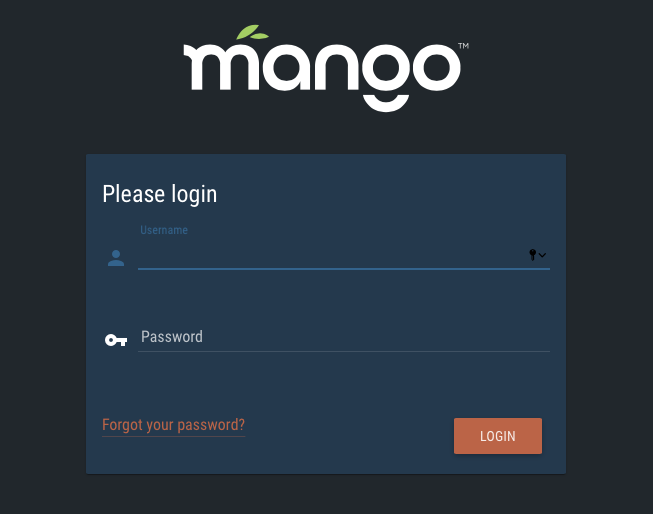
The Mango 4.0 user interface uses a modern HTML framework and is fully mobile responsive. You can start by logging into your system using admin for both the username and password to continue to the home page.
The home page gives you quick links to a lot of the useful tools and resources in the Mango system. This is for administrators and allows you to see how your system is configured, how many data points, data sources there are in the system, server status, etc.
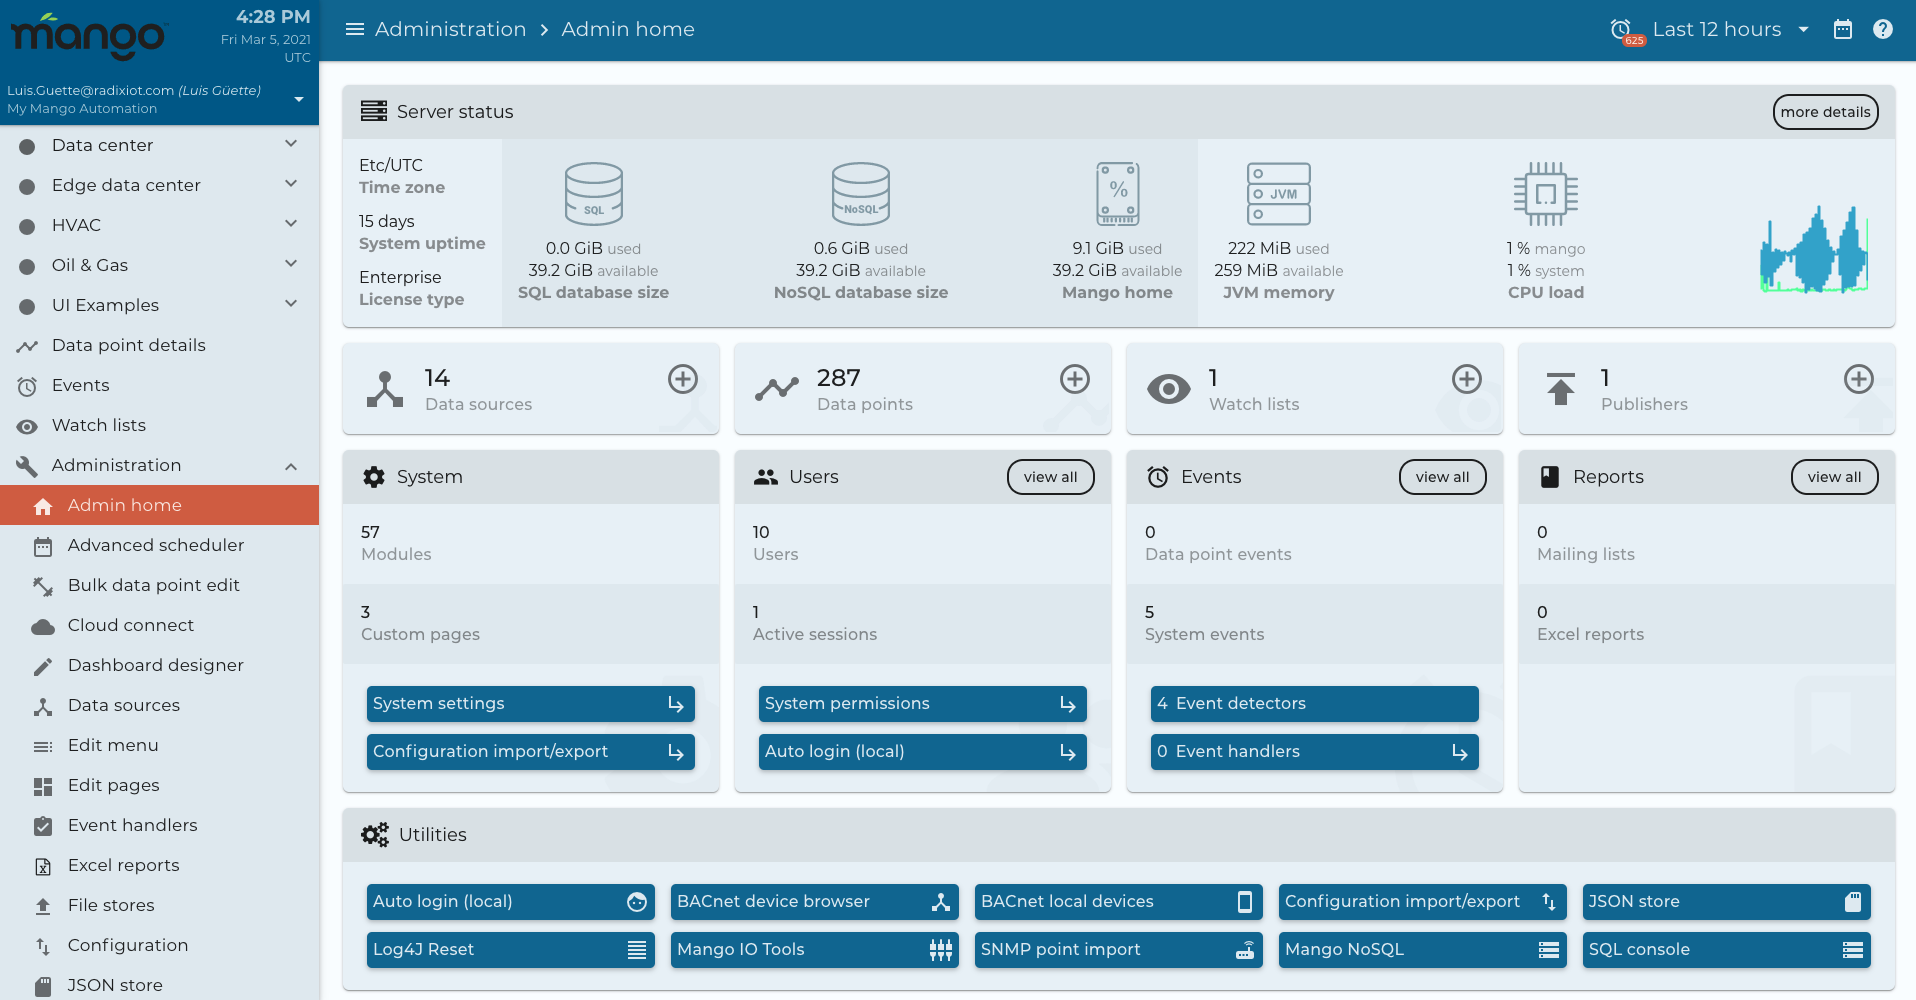
You can get a live view of how many active sessions there are and have a quick link to edit your settings.
The data point details view gives you detailed analysis of an individual data point with statistics and history queries.
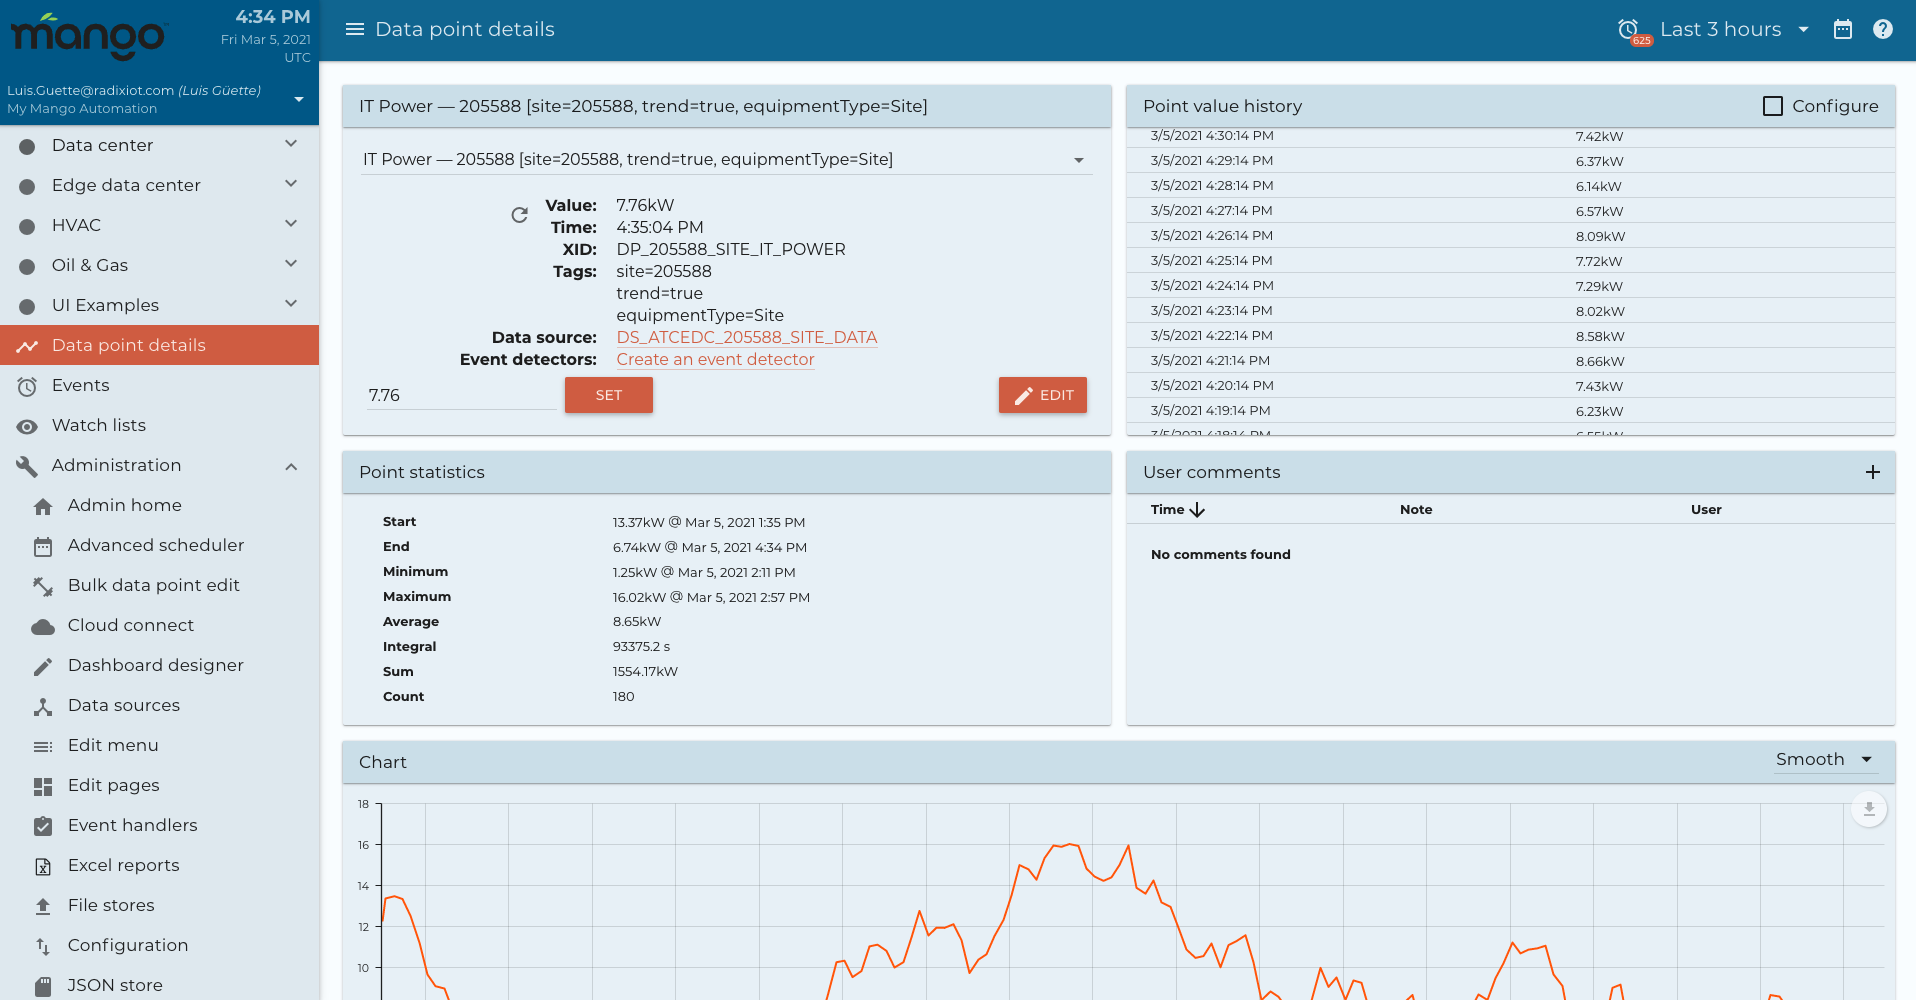
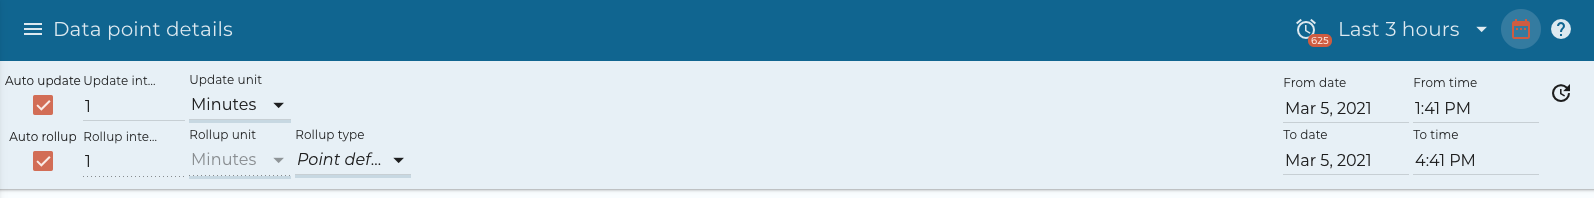
At the top of the page, you'll notice a date selector. This universal selector id used throughout the user interface for all pages. We have a simple selector that allows you to select from a basic time range.

You can click the calendar to expand a more advanced selector.
 .
.
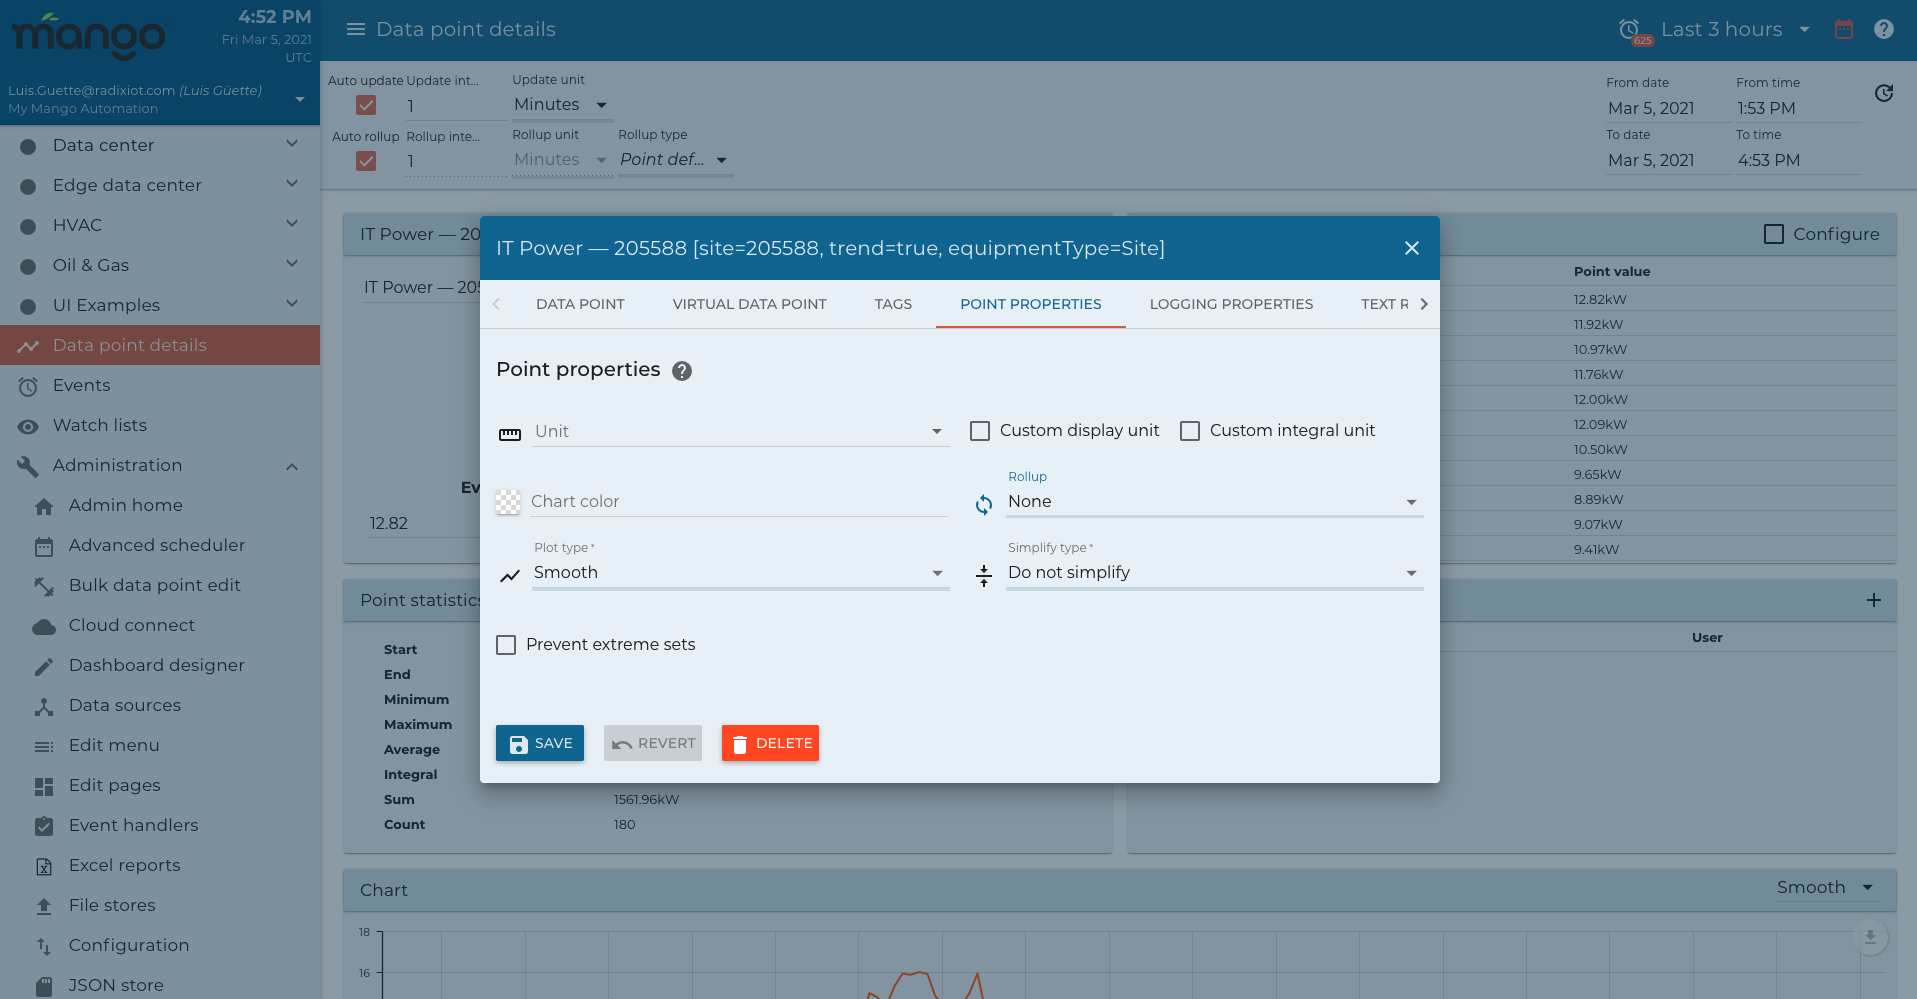
In the advanced selector you can select individual dates and times. Under the advanced selector you'll also notice some update intervals and, most importantly, the rollup interval and rollout type. Each data point in Mango OS has a rollup type that you can select, you can also select a rollup type to override and view the data with a different type of rollup. You can select your chart type as well.
If we look at the data point settings, you can preset these values. You'll see that there is a rollup type and a plot type. Here we have it selected at none, but we may want to select the rollup as an average, and a line or a bar plot type. This can become very useful, for example, if you have a kWh register or a water meter register that is an accumulator and keeps counting up. Oftentimes you may want to actually chart that as a Delta and a bar chart.
The watch list allows you to view combinations of data in a common list and configure a chart to display them. The top part of the watch list shows you the real time values, and you'll see the flashes as the values update. The chart is fully configurable, and you can select data points to be combined on different series while you select the type of chart, to be displayed.
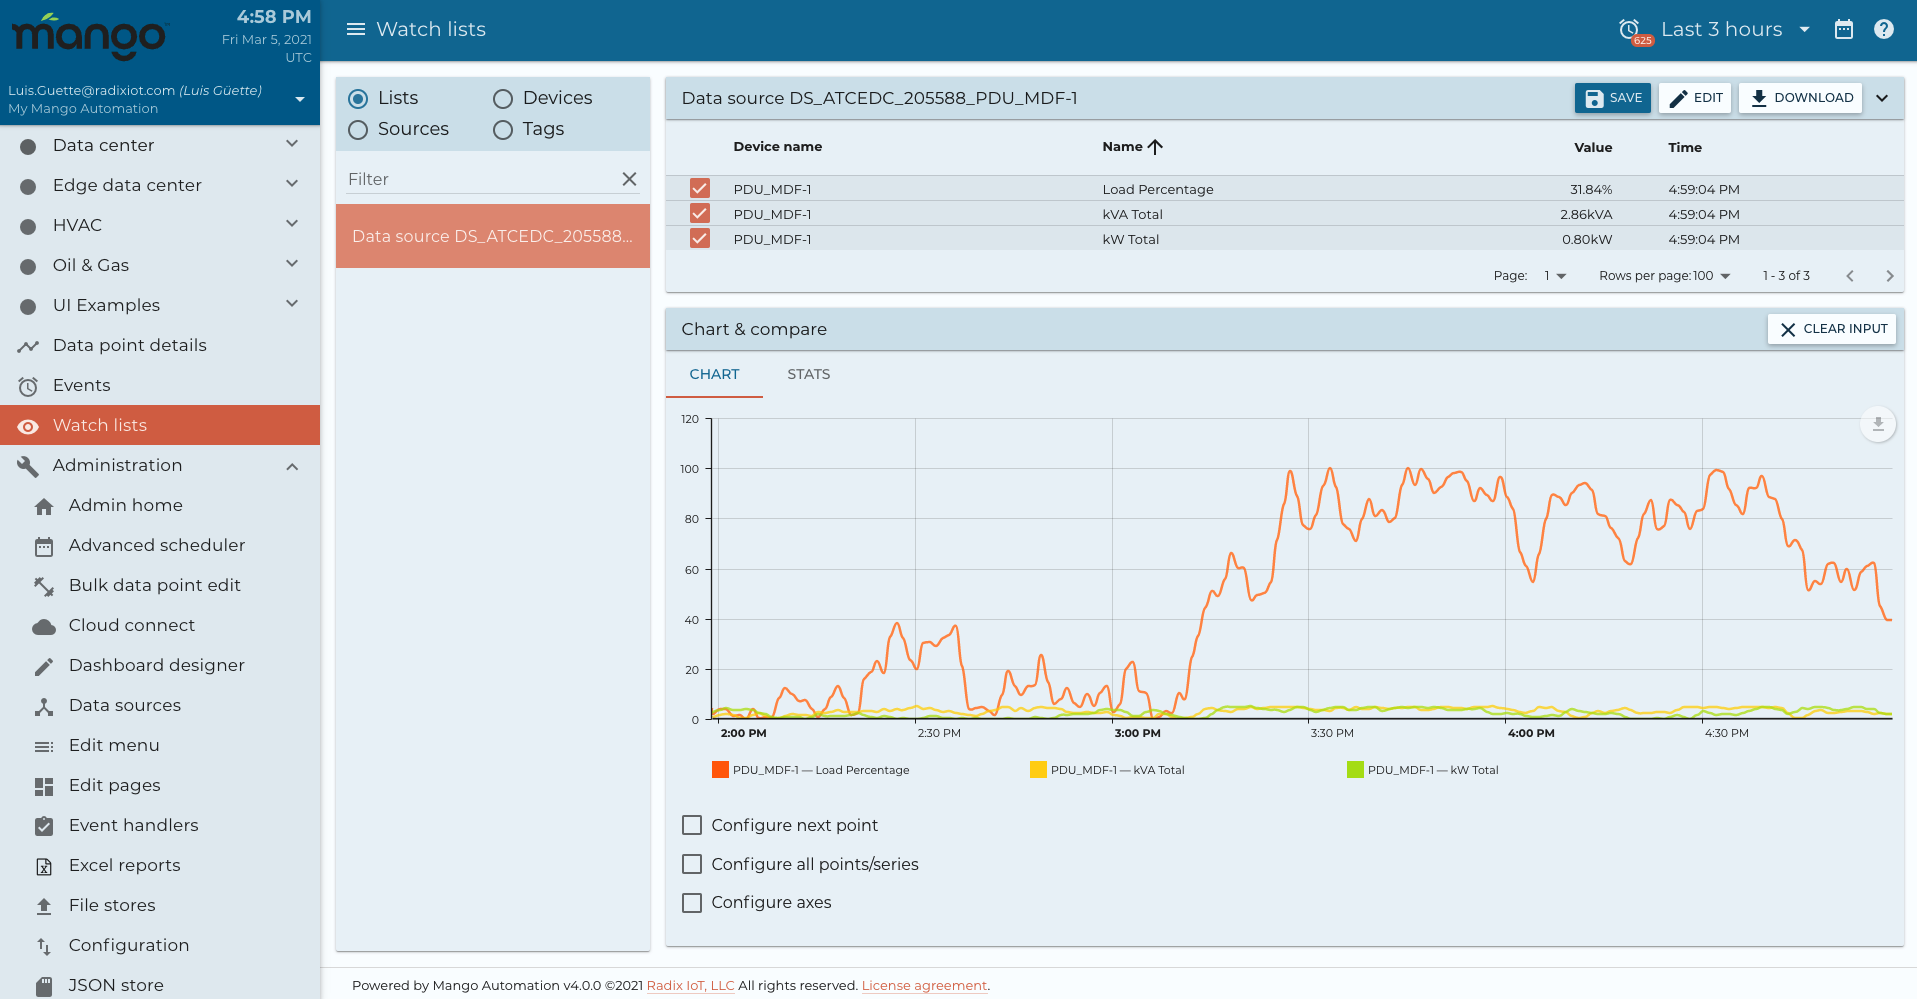
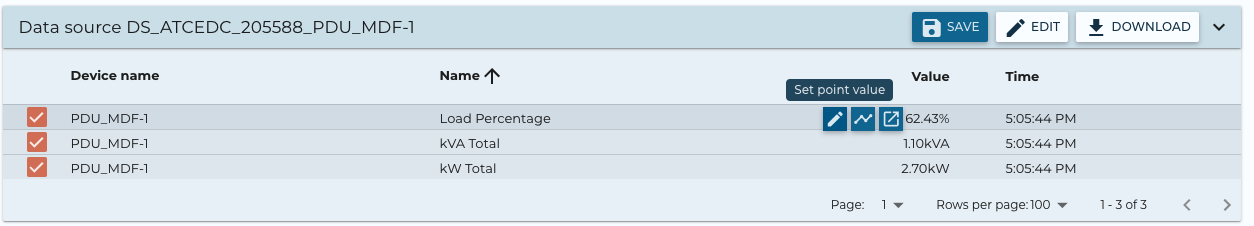
The watch list charts can be used in custom pages, you can also change datapoint values right here on the chart and get a quick statistical view.
For more information, check here.
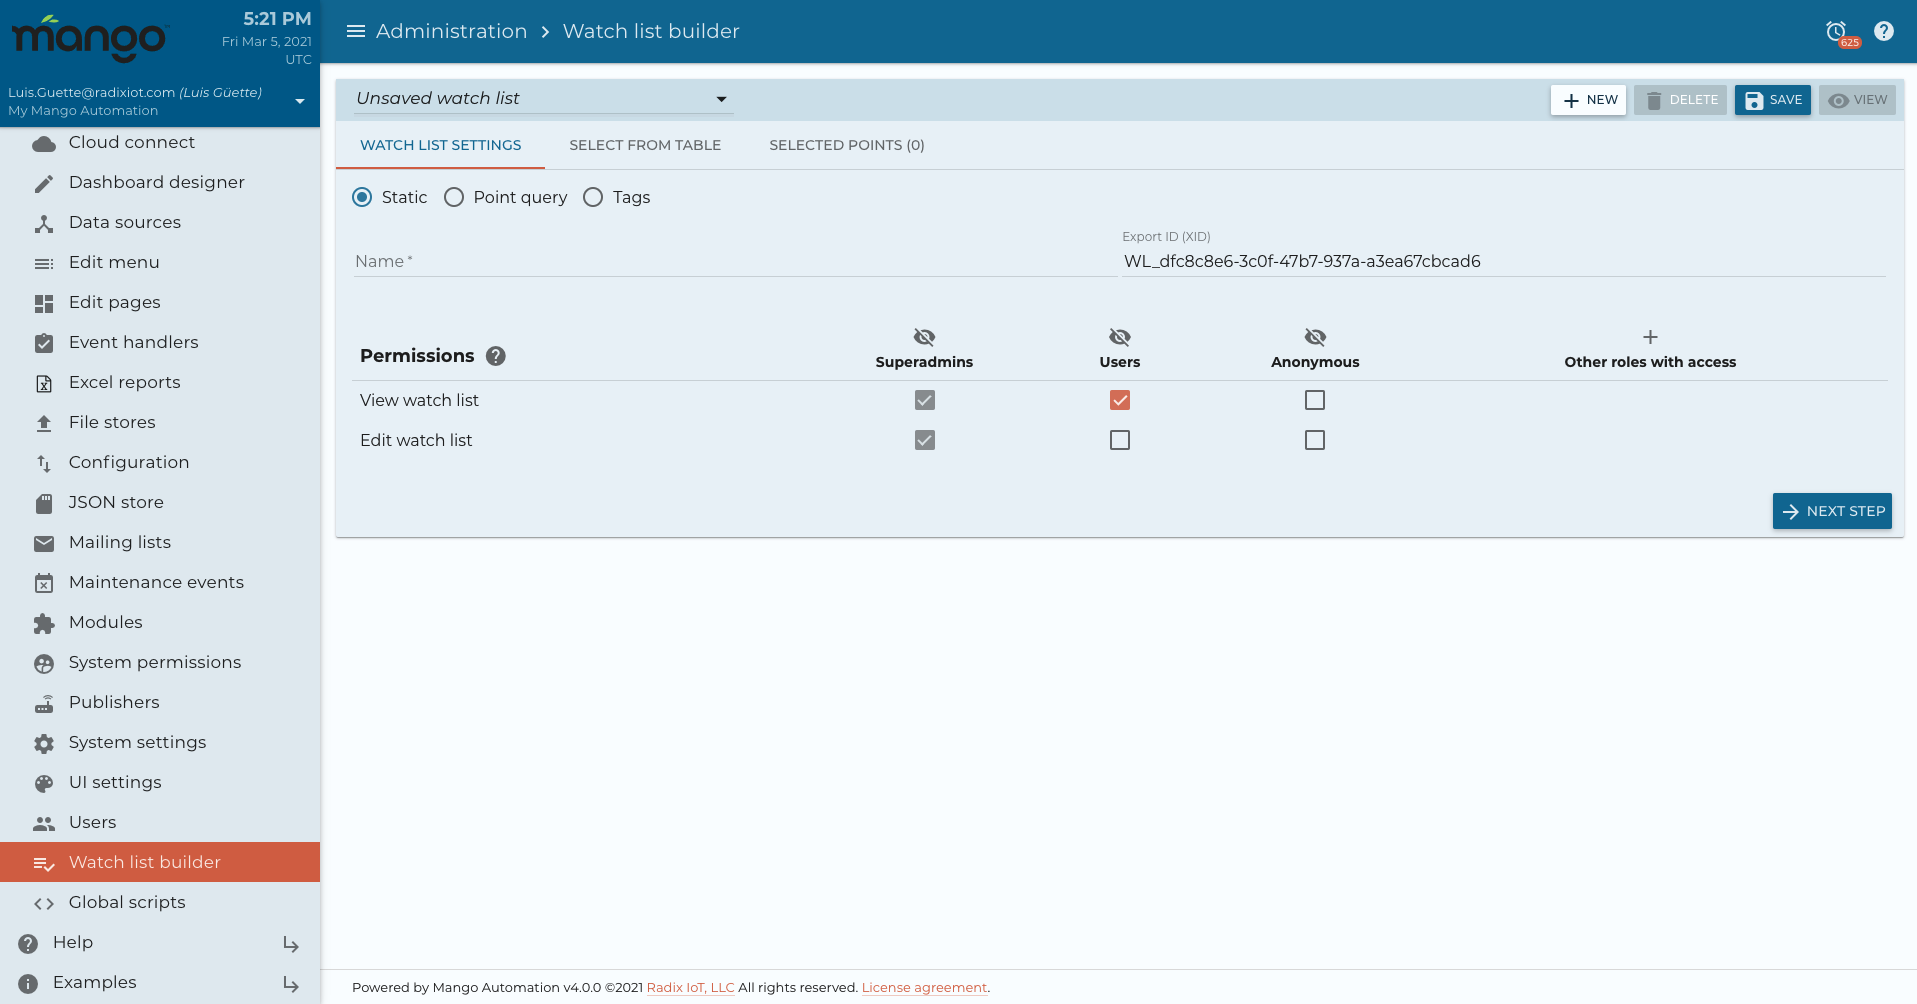
You can add a new watch list by clicking on watch list builder, and configure either a static, point query or tags.
- Static watch list is the simplest, we just select a group of data points to be displayed.
- Point queries are more advanced and allows you to use queries and expressions to make a dynamic watch list which can also then be used in your dashboard builder.
- Tags are used to filter a group of data points by its tags.
For more information, check here.
Events are alarms or notifications that have been configured in a system and there's several ways to filter and view these.
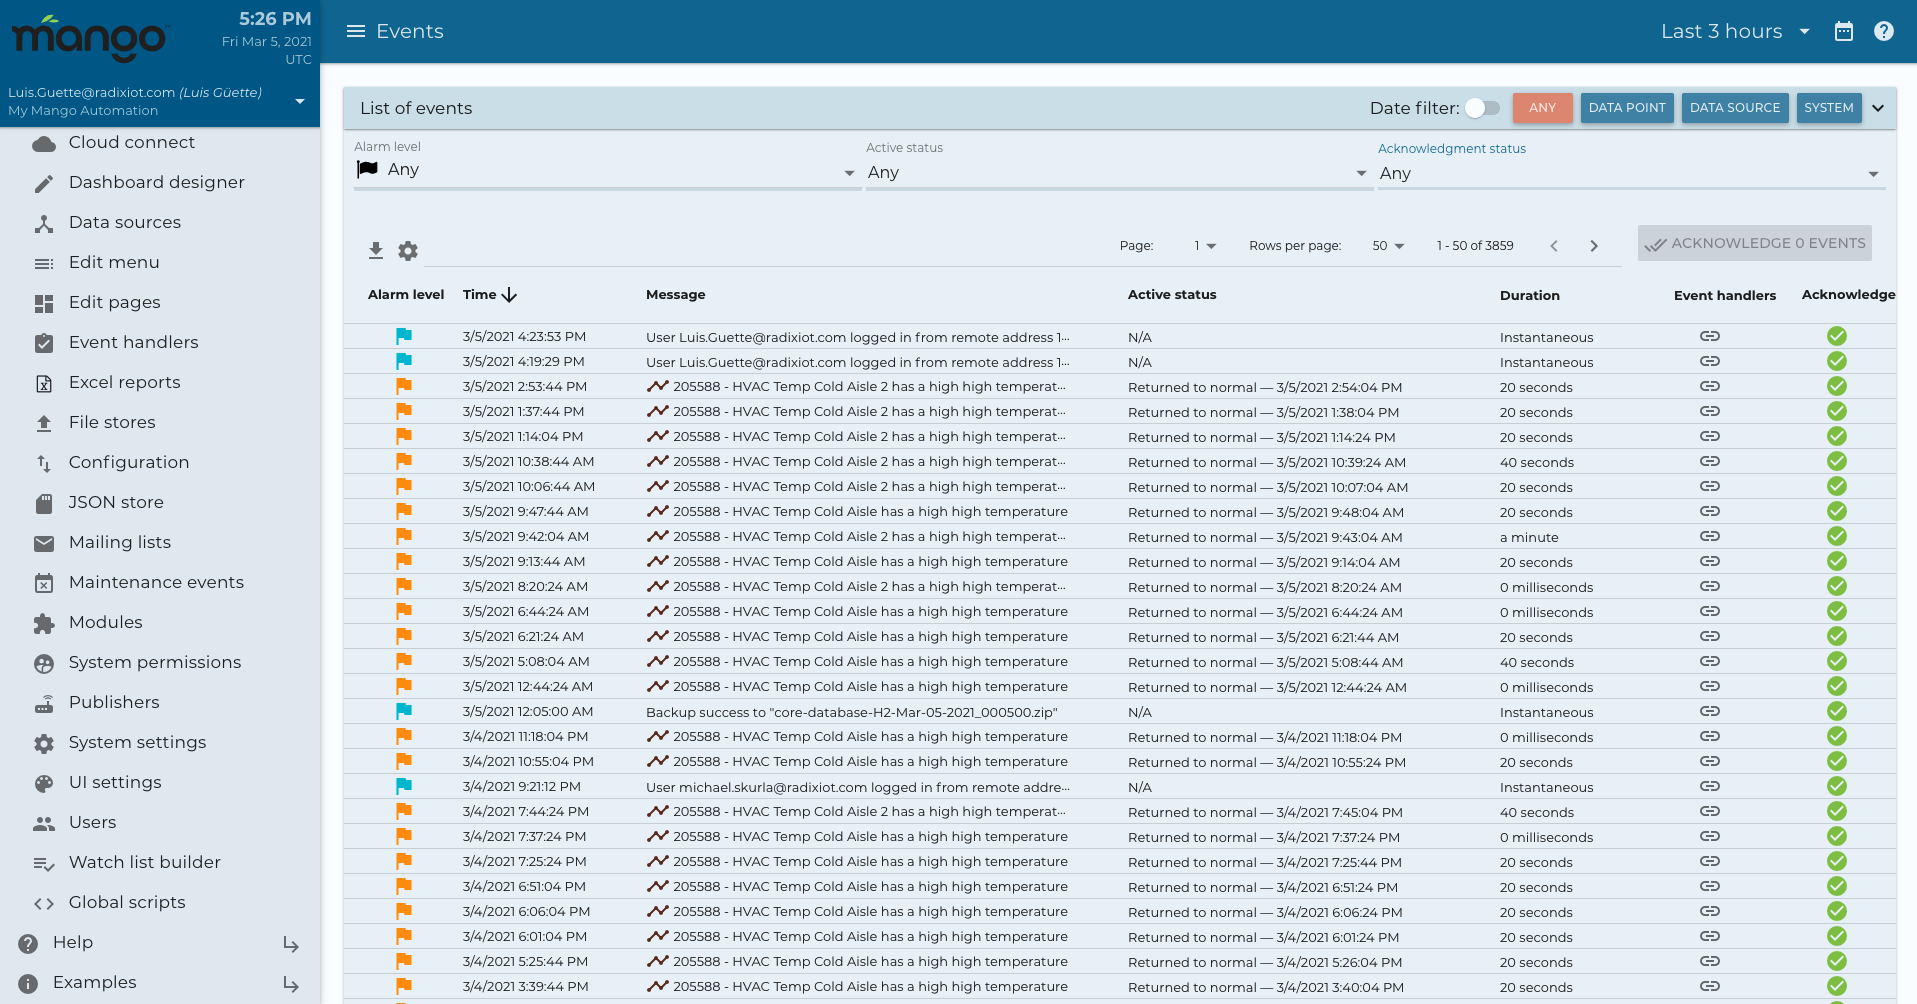
At the top you can look at data point events which are individual event detectors that you've configured such as high-level limits, low-level limits or other types of detectors. Data source events are things like communication timeouts and other exceptions that may happen on a data source. In system events are things like user logins, system startups or other system event types.
You can filter by alarm level, status and whether they're acknowledged or not, and you can use the acknowledge button to acknowledge them right on this screen.
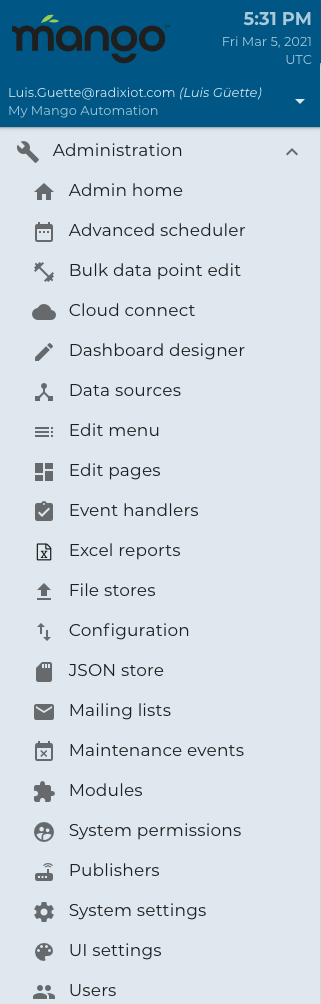
Under the administration menu you'll see how you can create data sources, build custom pages, users and use other tools.
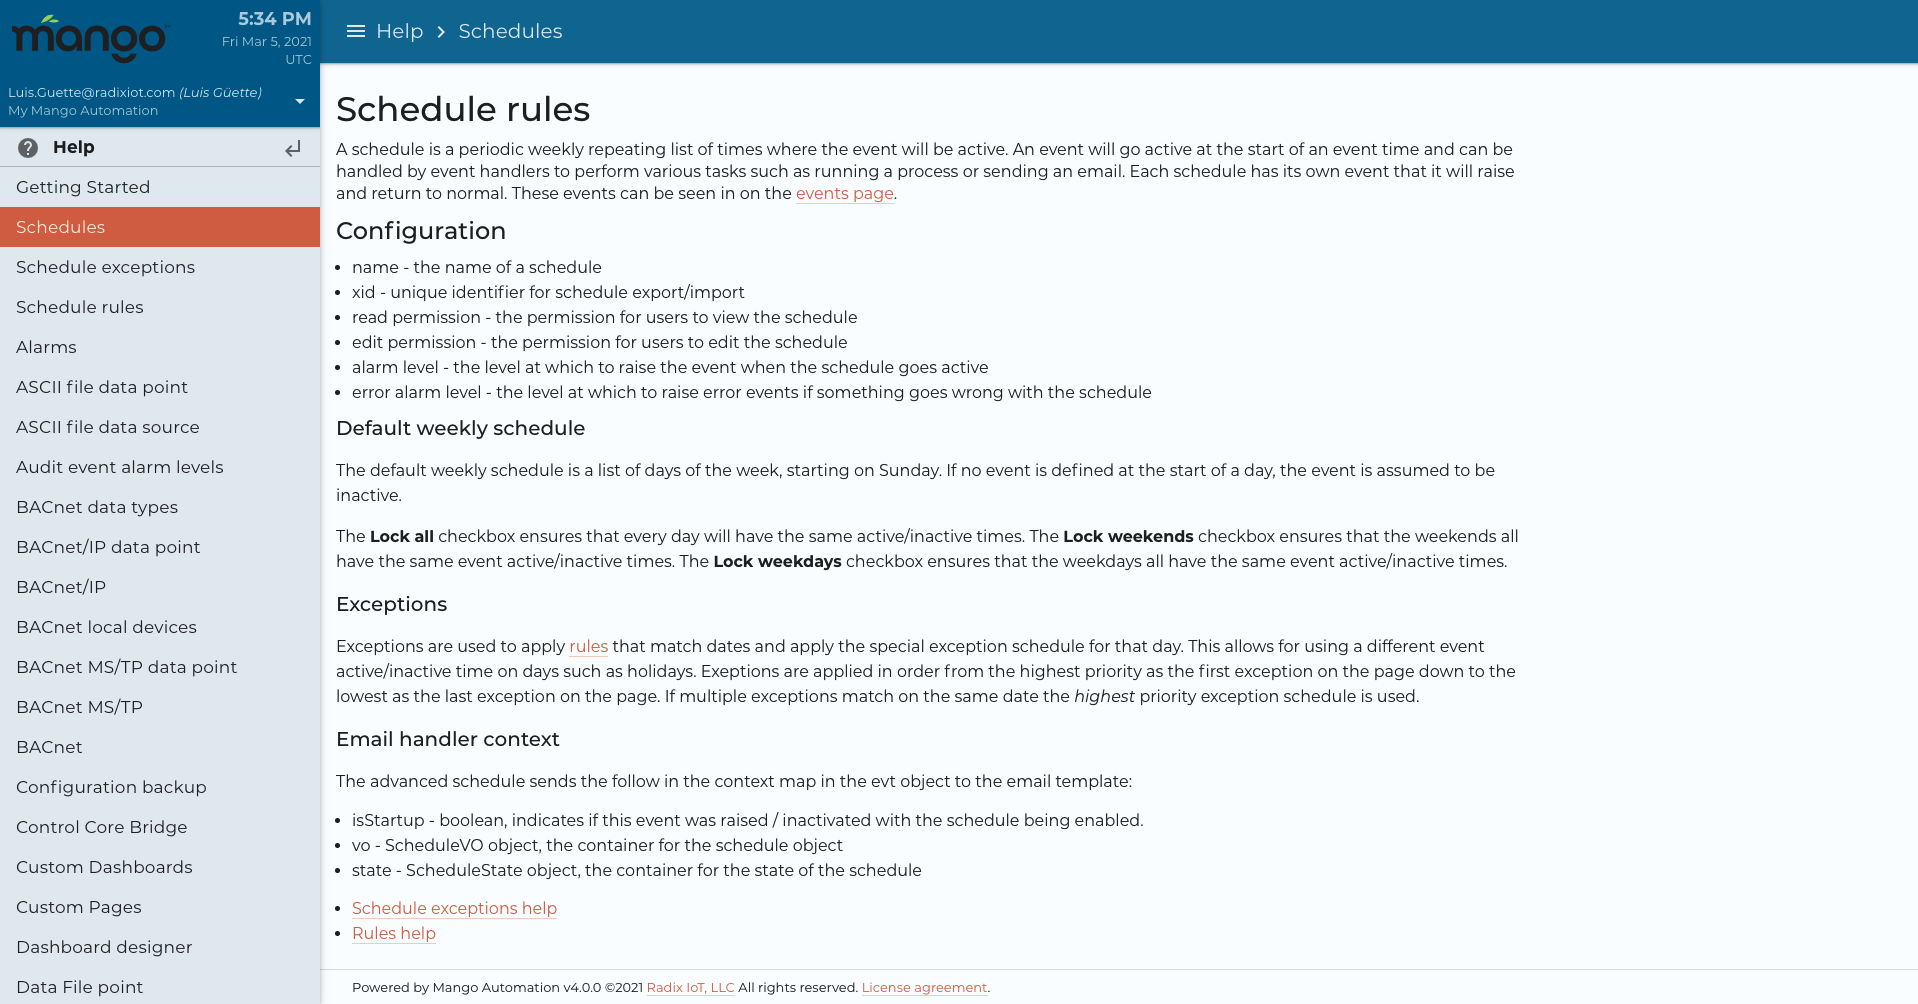
The help menu gives you important tips in detailed knowledge about how to use the various features in the user interface. You'll see below the help menu.
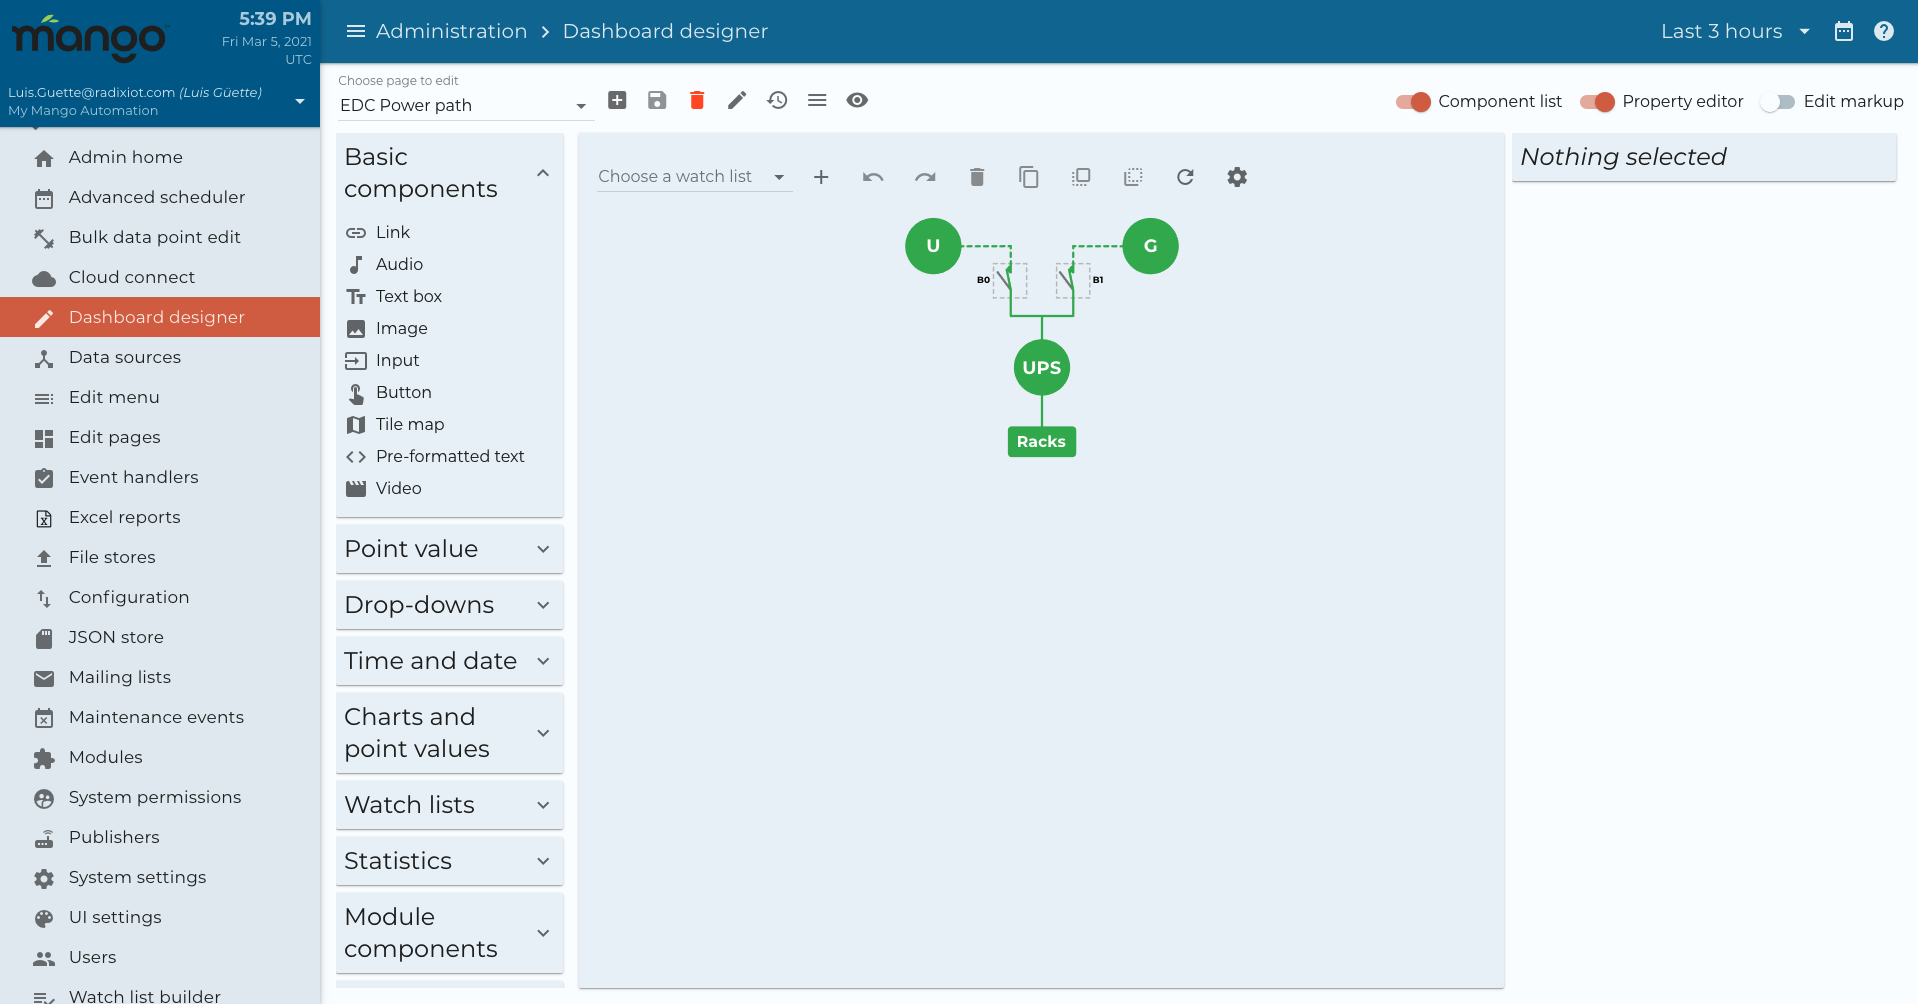
Mango OS UI is a powerful development framework for creating custom dashboards and applications. Under the administration menu you will find the dashboard designer, edit pages and edit menu.
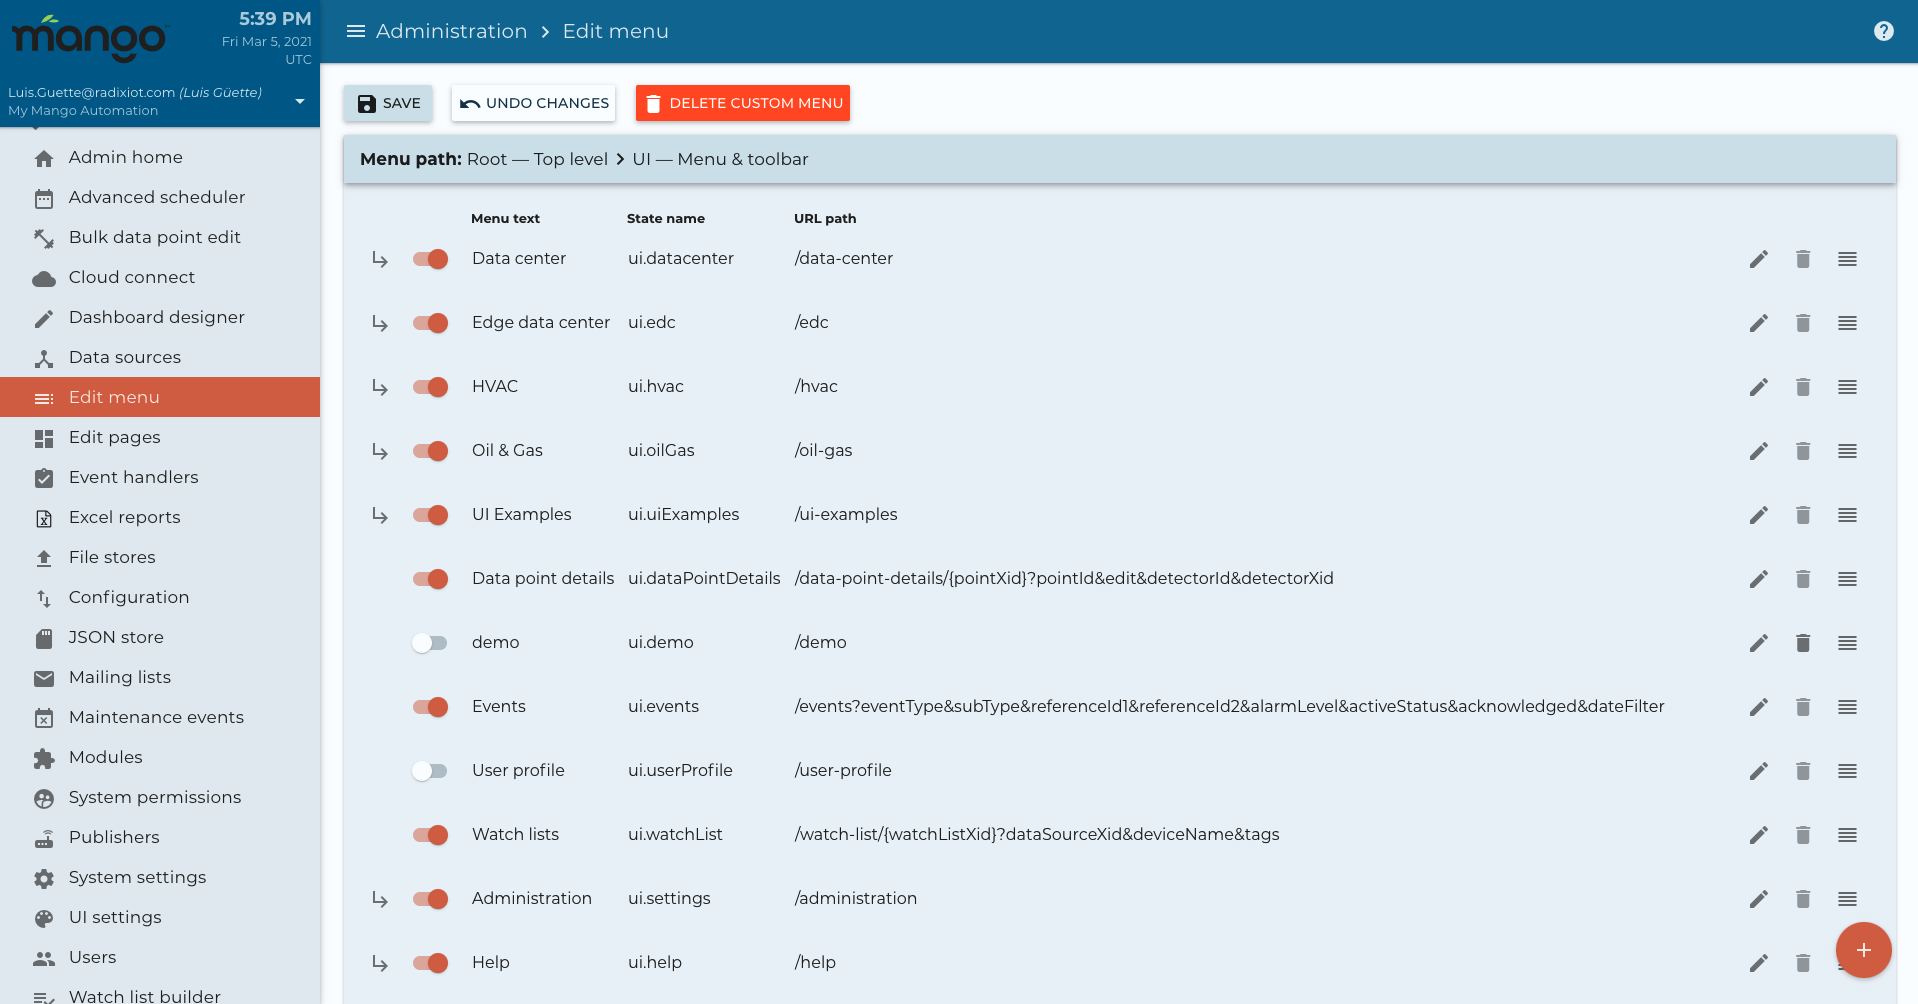
Edit menu allows you to create your own menu items that link to custom pages, define user permissions and turn some items on/off that you may not want to see.
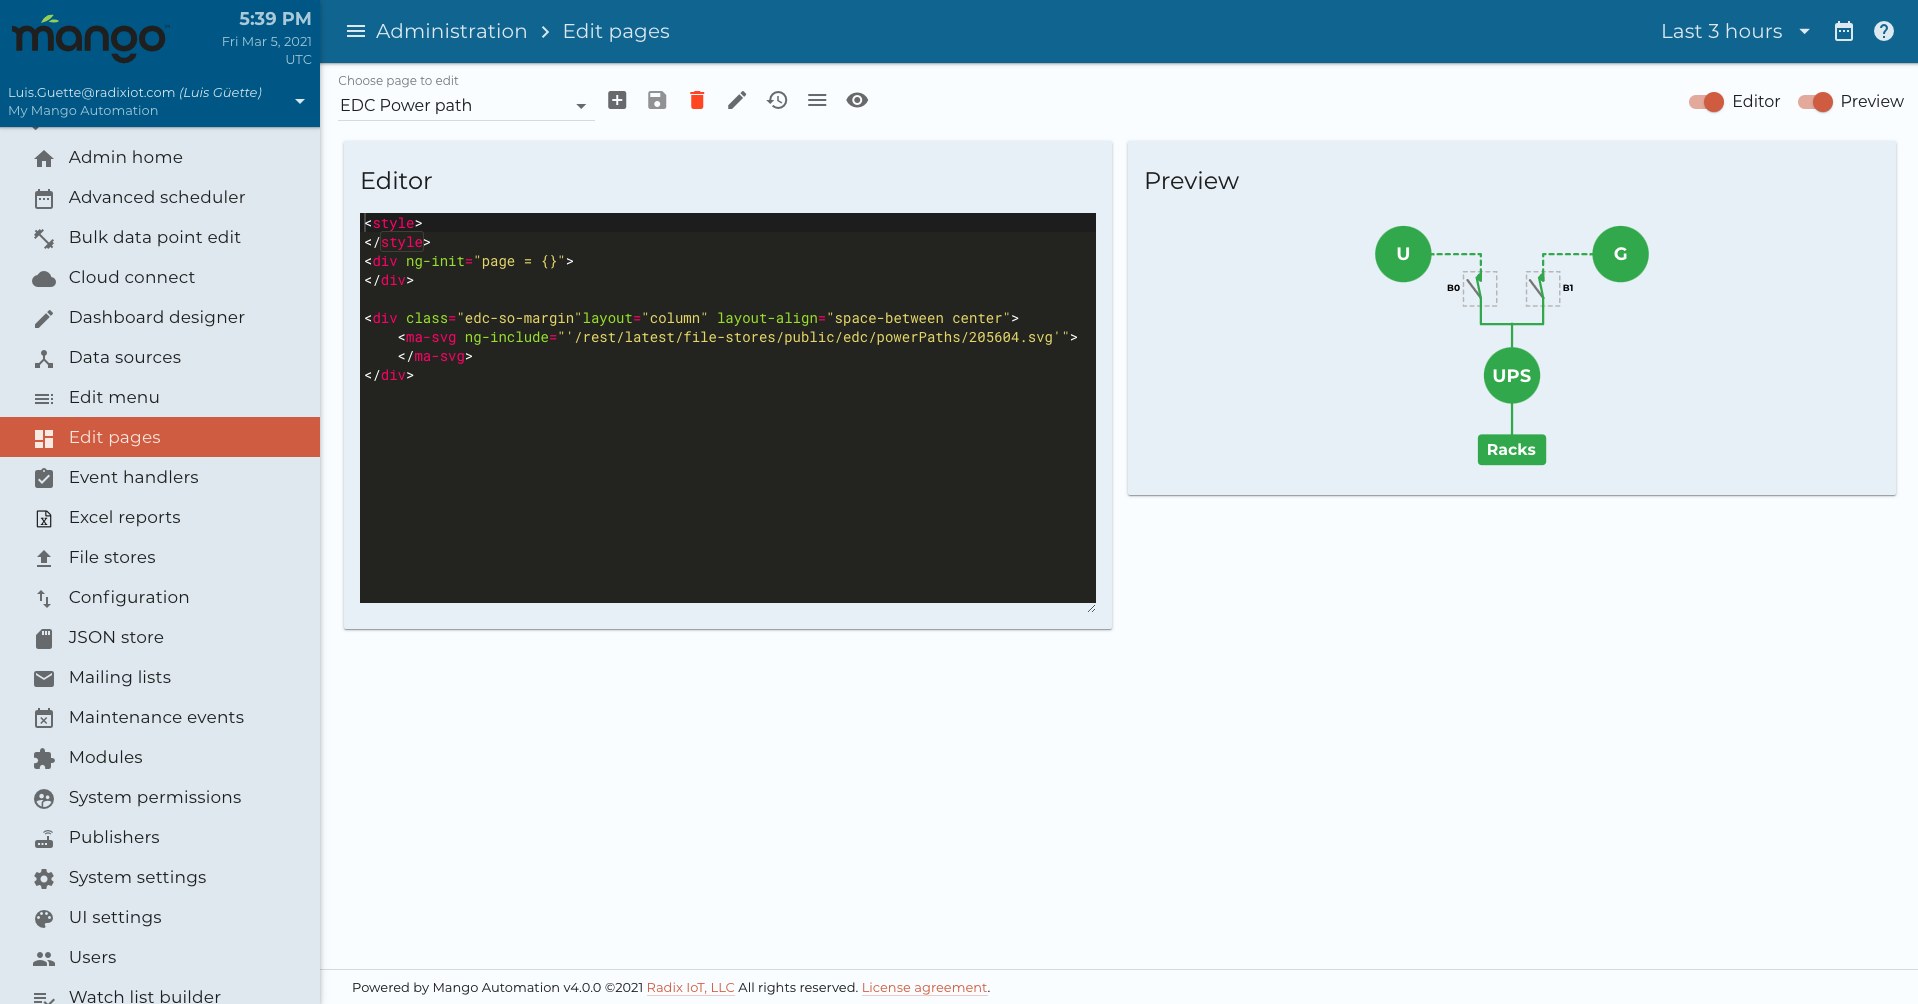
The edit pages allow you to edit pages in pure code.
The dashboard designer allows you to edit pages in a drag and drop framework.