This is the 6th article of a Dashboard development series. You can check all the articles by clicking here
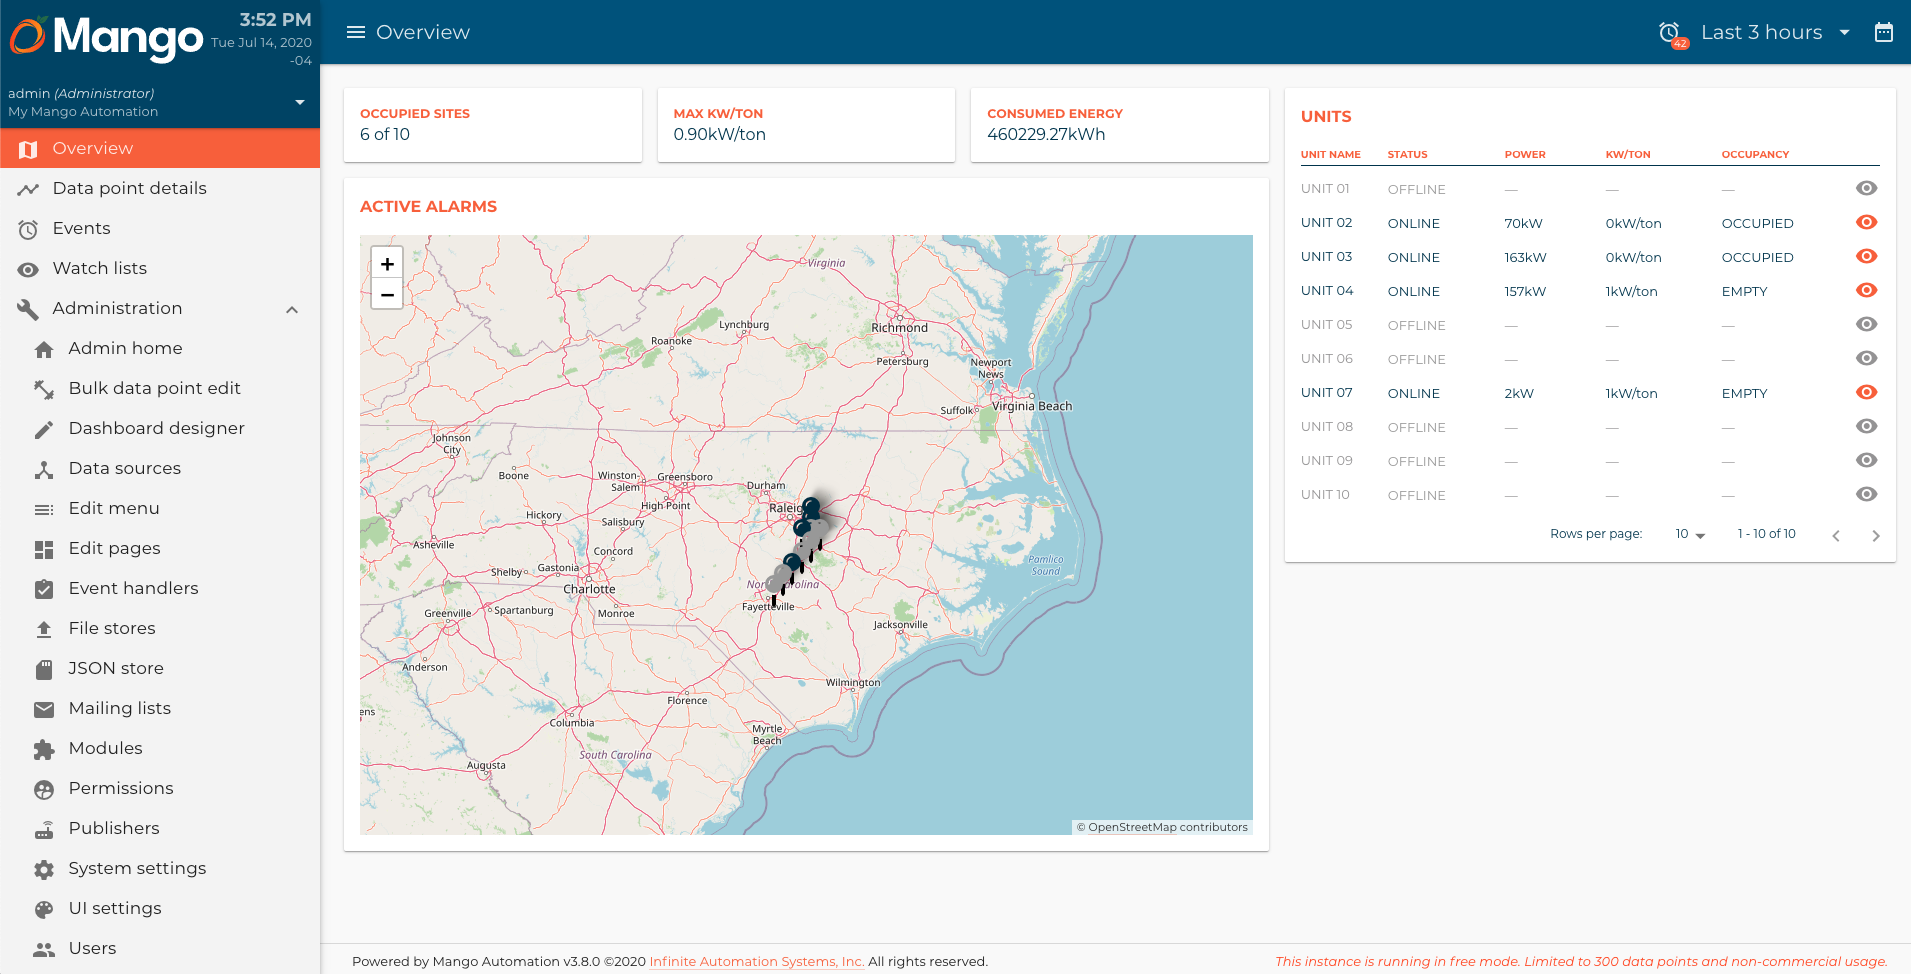
In this article we are going to build the next KPI indicators component:

This component shows general Key performance indicators in 3 cards, occupied sites, máximum kW/ton ratio, and consumed energy. Let's start by creating the kpiIndicators.js and kpiIndicators.html files in the components/kpiIndicators directory:
kpiIndicators.js
/**
 * @copyright 2020 {@link http://infiniteautomation.com|Infinite Automation Systems, Inc.} All rights reserved.
 * @author Luis Güette
 */
define(['angular', 'require'], (angular, require) => {
'use strict';
class KpiIndicatorsController {
    static get $$ngIsClass() {
        return true;
    }

    static get $inject() {
        return [];
    }

    constructor() {

    }

    $onInit() {

    }
}

return {
    bindings: {

    },
    controller: KpiIndicatorsController,
    templateUrl: require.toUrl('./kpiIndicators.html')
};

});
kpiIndicators.html
<h1>KPI Indicators</h1>
Then, we need to import it in hvac.js module:
hvac.js
/**
 * @copyright 2020 {@link http://infiniteautomation.com|Infinite Automation Systems, Inc.} All rights reserved.
 * @author Luis Güette
 */
define([
'angular',
'require',
'./pages/overview/overview.js',

'./components/map/map.js',
'./components/selectedUnitCard/selectedUnitCard.js',
'./components/unitsTable/unitsTable.js',
'./components/kpiIndicators/kpiIndicators.js',

'./services/unit.js'

], (
angular,
require,
overview,
map,
selectedUnitCard,
unitsTable,
kpiIndicators,
unitService
) => {
'use strict';
const hvacModule = angular
    .module('hvacModule', ['maUiApp'])
    .component('hvacOverview', overview)
    .component('hvacMap', map)
    .component('hvacSelectedUnitCard', selectedUnitCard)
    .component('hvacUnitsTable', unitsTable)
    .component('hvacKpiIndicators', kpiIndicators)

    .factory('hvacUnit', unitService);

hvacModule.config([
    'maUiMenuProvider',
    (maUiMenuProvider) => {
        maUiMenuProvider.registerMenuItems([
            {
                name: 'ui.overview',
                url: '/overview',
                menuIcon: 'map',
                template: '<hvac-overview></hvac-overview>',
                menuText: 'Overview',
                weight: 100
            },
        ]);
    }
]);

return hvacModule;

}); // define
Let's call the hvac-kpi-indicators component in the overview.html file:
overview.html
<div layout="row" layout-wrap layout-align="space-between start">
<div flex="100" flex-gt-sm="50" flex-gt-md="60">
<div>
<hvac-kpi-indicators></hvac-kpi-indicators>
</div>
<md-card>
<md-card-header>
<p md-colors="::{color: 'accent'}">Active Alarms</p>
</md-card-header>
<md-card-content>
<hvac-map units="$ctrl.units" on-select-unit="$ctrl.onSelectUnit(unit)"></hvac-map>
</md-card-content>
</md-card>
<hvac-selected-unit-card ng-if="$ctrl.selectedUnit" unit="$ctrl.selectedUnit"></hvac-selected-unit-card>
</div>
<div flex="100" flex-gt-sm="50" flex-gt-md="40">
<md-card>
<md-card-header>
<p md-colors="::{color: 'accent'}">Units</p>
</md-card-header>
<md-card-content>
<hvac-units-table units="$ctrl.units"></hvac-units-table>
</md-card-content>
</md-card>
</div>
</div>
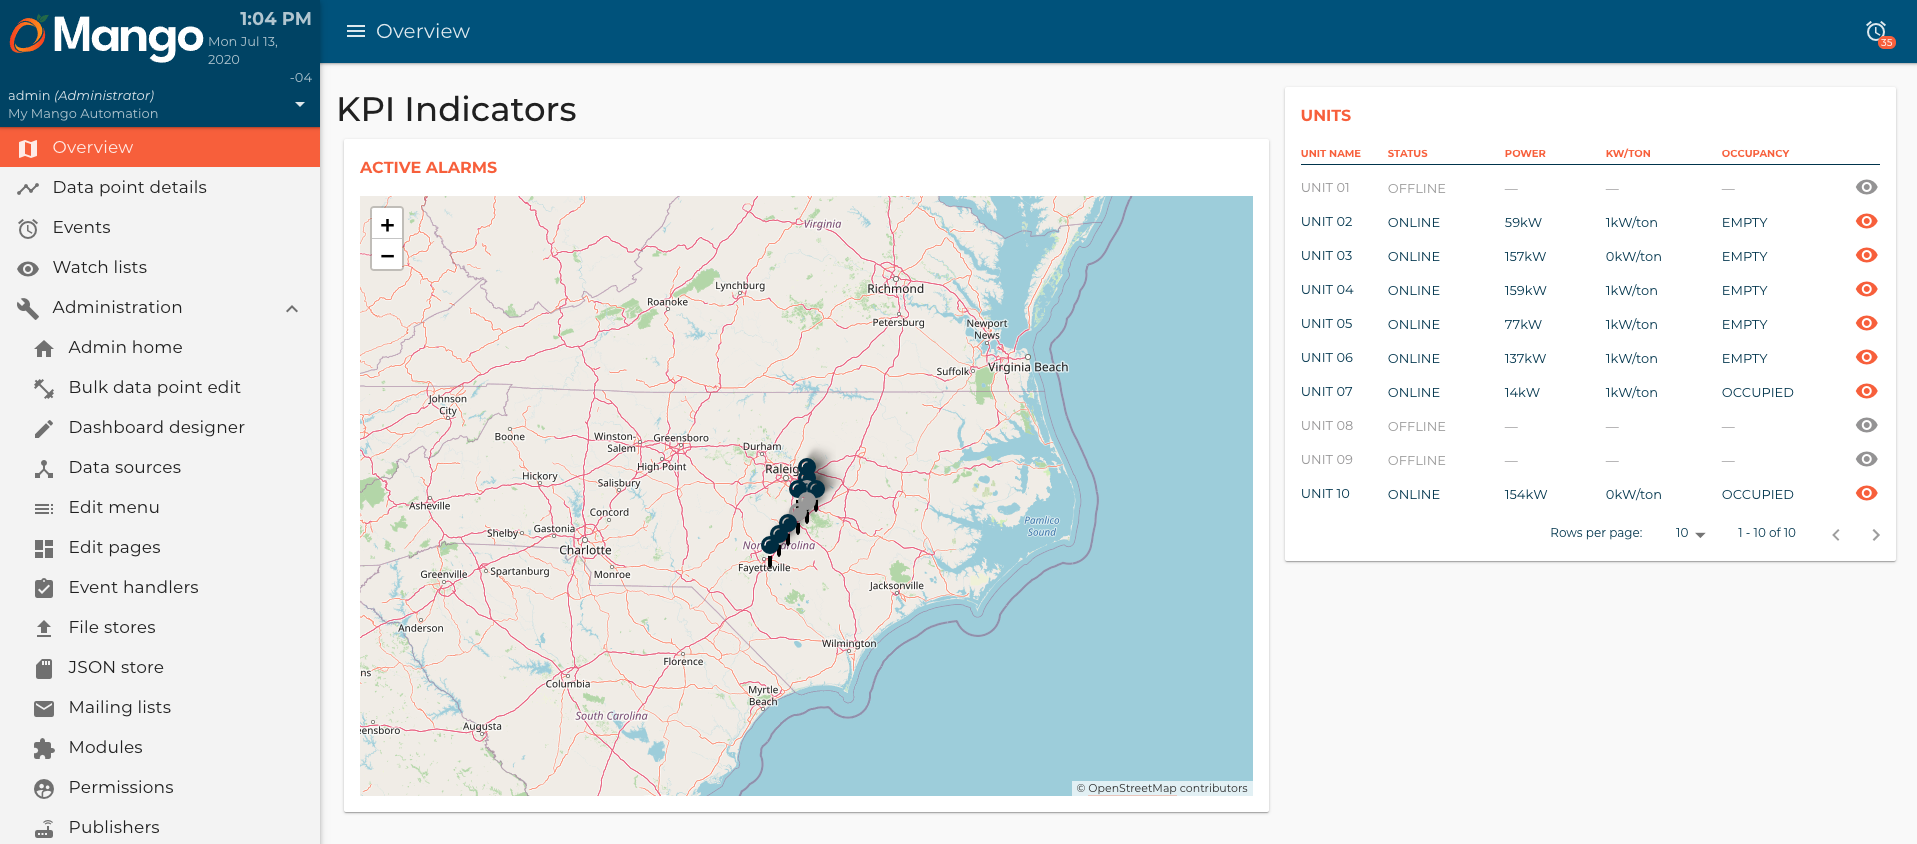
Reload the page, and you should see something like this:
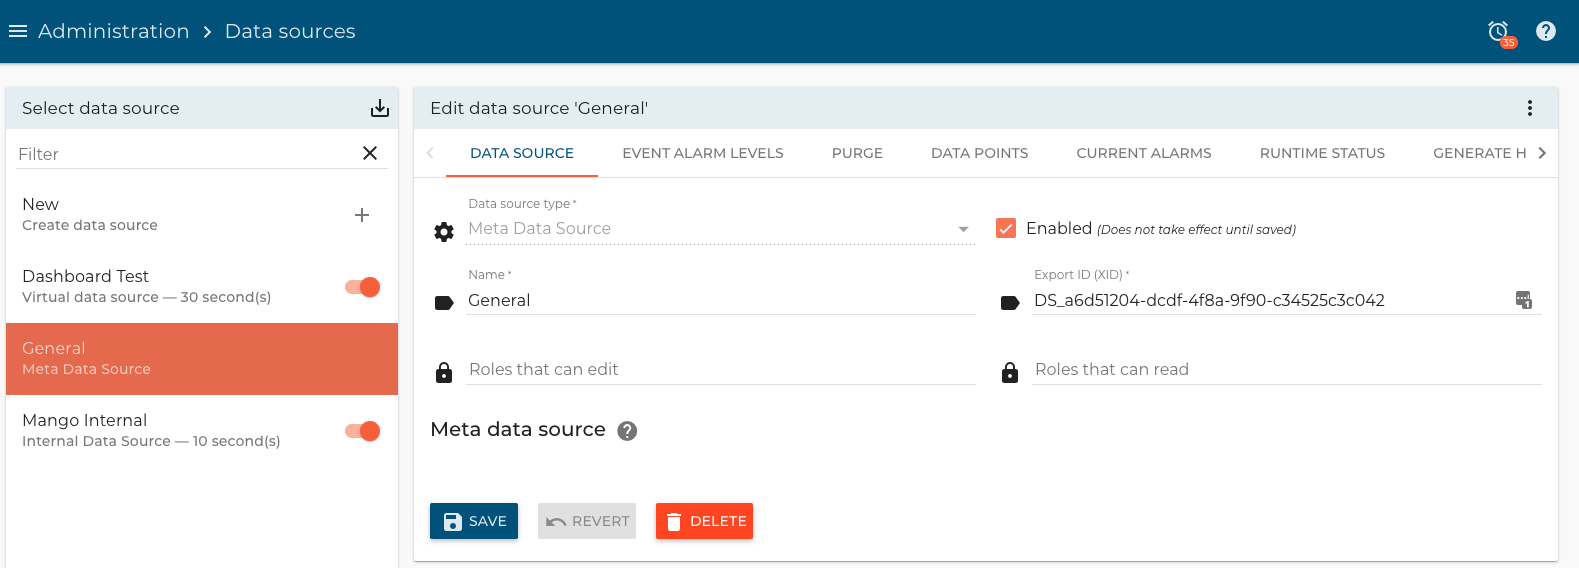
Now, let's create the meta data points that store this KPIs. Go to the Data sources page and "General" meta data source:
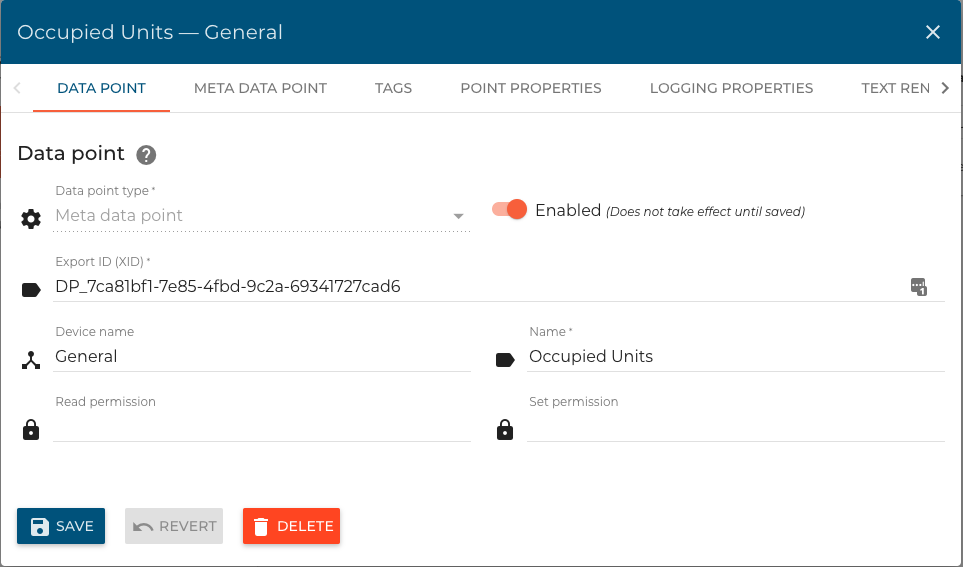
Occupied units data point
The occupied units data point returns the number of units where the occupancy are equal to true.
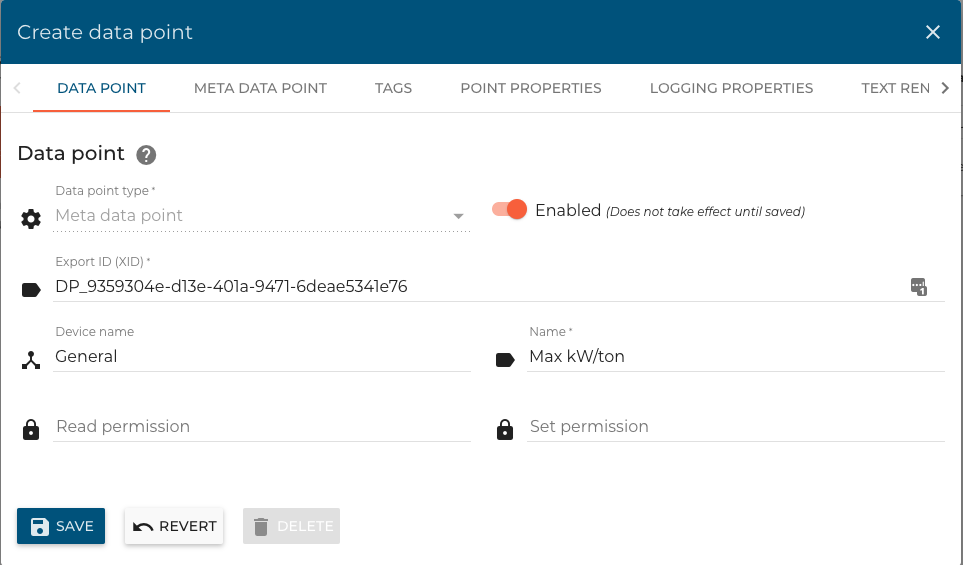
For this data point, set the Name as Occupied Units, and the Device name leave it as General.
Go to the Meta data point tab, set the Data type as Numeric, and the Variable name as occupiedUnits.
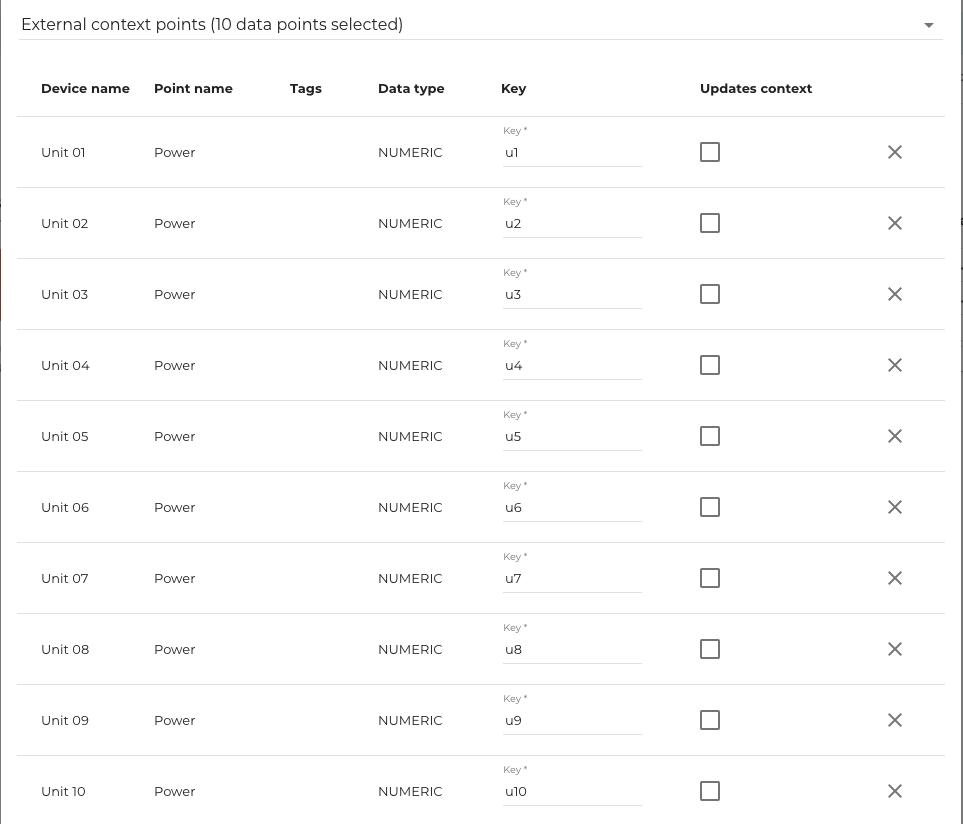
In the External context points, add all the unit occupancies like this:
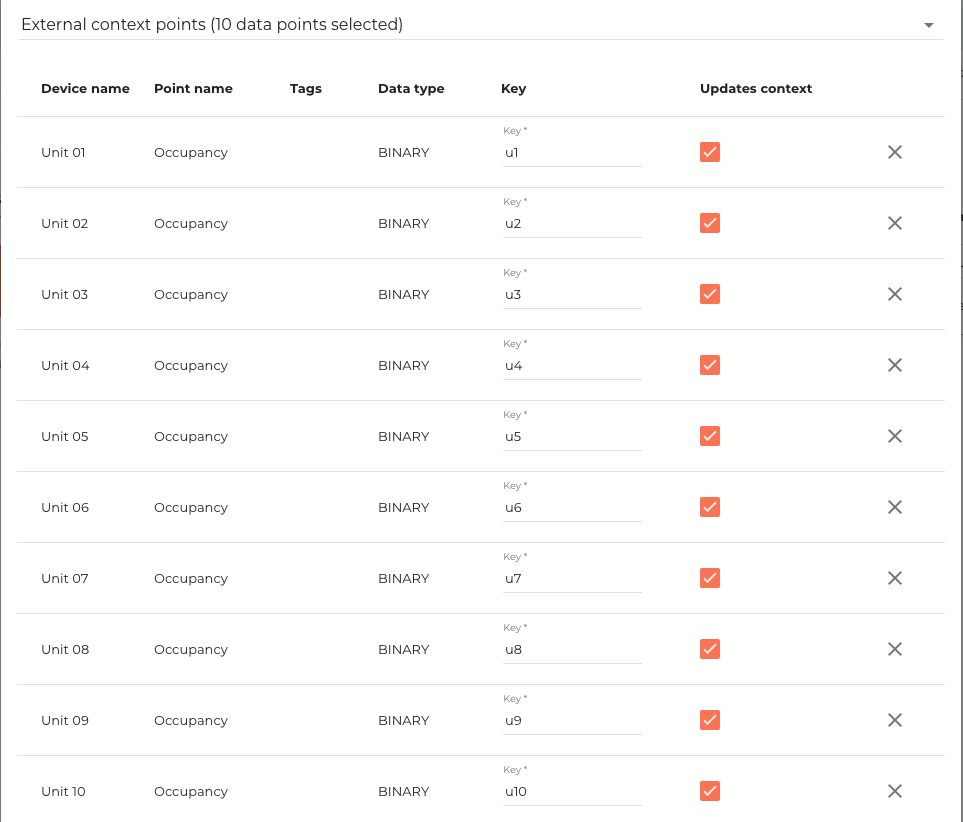
In the Sctript section, add the next code:
var values = [u1.value, u2.value, u3.value, u4.value, u5.value, u6.value, u7.value, u8.value, u9.value, u10.value];
return values.filter(function (item) {return item === true}).length;
Now, set the Context event type as Change so it updates only when one of the context points change its value.
Finally, go to the Text renderer properties and set the Format as #, so it shows a number without decimals. Click Save.
Maximum kW/ton ratio data point
This data point calculates the max kW/ton ratio among all units.
Set the Name as Max kW/ton, and the Device name leave it as General.
Go to the Meta data point tab, set the Data type as Numeric, and the Variable name as maxKwTon.
In the External context points, add all the unit kW/ton ratios like this:
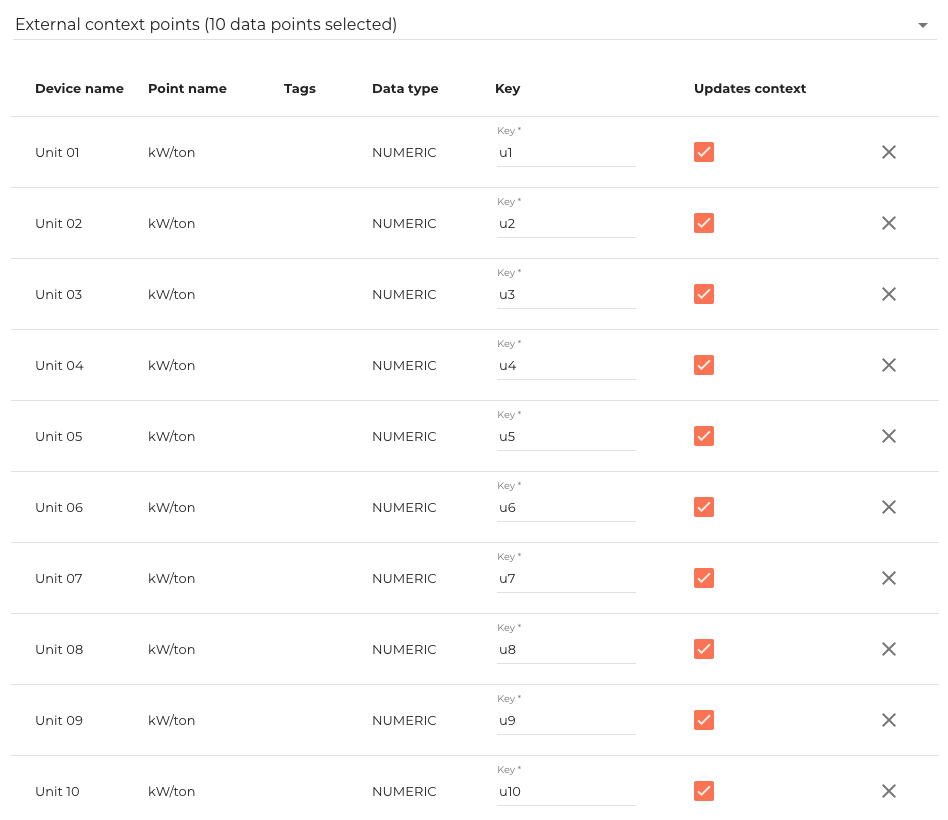
In the Sctript section, add the next code:
var values = [u1.value, u2.value, u3.value, u4.value, u5.value, u6.value, u7.value, u8.value, u9.value, u10.value];
return Math.max.apply(null, values);
Now, set the Context event type as Change so it updates only when one of the context points change its value.
Finally, go to the Text renderer properties and set the Suffix as kW/ton. Click Save.
Consumed energy data point
This data point calculates the total kWh of all the units together.
Set the Name as Consumed Energy, and the Device name leave it as General.
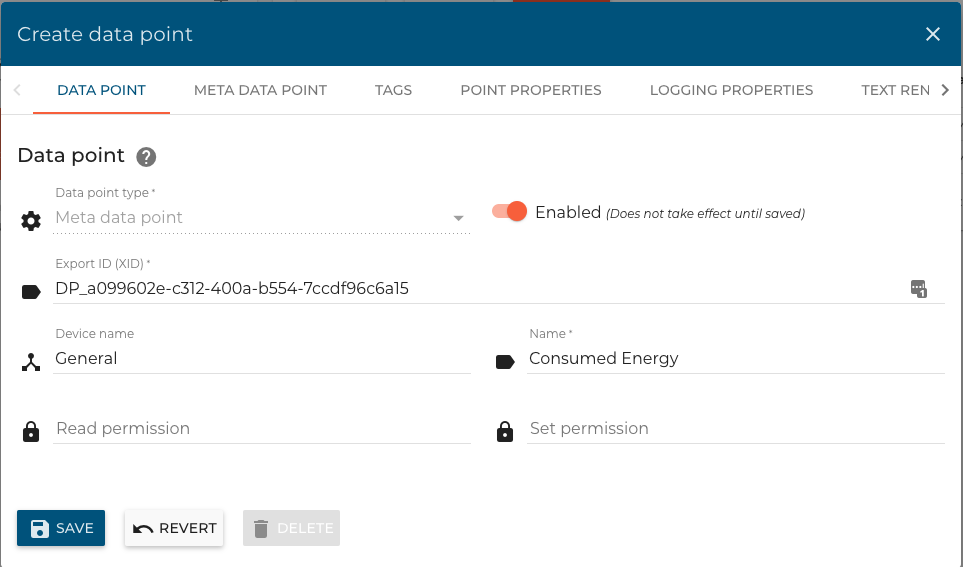
Go to the Meta data point tab, set the Data type as Numeric, and the Variable name as consumedEnergy.
In the External context points, add all the unit powers like this:
This data point needs to starts its value in 0. So we check the Settable checkbox. Then, In the Sctript section, add the next code for now:
return 0;
Click Save and go to the data point details page to set its value in 0. Then, return to edit the data point script like this:
return consumedEnergy.value
    + (u1.past(MINUTE, 5).average / 12)
    + (u2.past(MINUTE, 5).average / 12)
    + (u3.past(MINUTE, 5).average / 12)
    + (u4.past(MINUTE, 5).average / 12)
    + (u5.past(MINUTE, 5).average / 12)
    + (u6.past(MINUTE, 5).average / 12)
    + (u7.past(MINUTE, 5).average / 12)
    + (u8.past(MINUTE, 5).average / 12)
    + (u9.past(MINUTE, 5).average / 12)
    + (u10.past(MINUTE, 5).average / 12);
Now, set the Timer update event as Cron pattern and set the Cron patter as * 0/5 * * * ? so it updates every 5 minutes.
Finally, go to the Text renderer properties and set the Suffix as kWh. Click Save.
Now that we have the data points. Let's get them in the kpiIndicators component. We also need to pass the total number of units to the component.
kpiIndicators.js
/**
 * @copyright 2020 {@link http://infiniteautomation.com|Infinite Automation Systems, Inc.} All rights reserved.
 * @author Luis Güette
 */
define(['angular', 'require'], (angular, require) => {
'use strict';
const POINT_KEYS = {
    'Occupied Units': 'occupiedUnits',
    'Max kW/ton': 'maxKwTon',
    'Consumed Energy': 'energy',
}

class KpiIndicatorsController {
    static get $$ngIsClass() {
        return true;
    }

    static get $inject() {
        return ['maPoint'];
    }

    constructor(Point) {
        this.Point = Point;
    }

    $onInit() {
        this.Point
            .buildQuery()
            .eq('deviceName', 'General')
            .limit(1000)
            .query()
            .then(points => {
                this.points = {}

                points.forEach(point => {
                    this.points[POINT_KEYS[point.name]] = point
                })
            })
    }
}

return {
    bindings: {
        unitsCount: '<'
    },
    controller: KpiIndicatorsController,
    templateUrl: require.toUrl('./kpiIndicators.html')
};

});
Finally, we update the kpiIndicators.html and add some styles in hvac.css:
kpiIndicators.html
<div layout="row" layout-wrap layout-align="space-between start">
<md-card flex="100" flex-gt-md="30">
<md-card-content>
<p>Occupied Sites</p>
<span>
<ma-point-value point="$ctrl.points.occupiedUnits"></ma-point-value>
of
{{ $ctrl.unitsCount }}
</span>
</md-card-content>
</md-card>
<md-card flex="100" flex-gt-md="30">
<md-card-content>
<p>Max kW/ton</p>
<ma-point-value point="$ctrl.points.maxKwTon"></ma-point-value>
</md-card-content>
</md-card>
<md-card flex="100" flex-gt-md="30">
<md-card-content>
<p>Consumed Energy</p>
<ma-point-value point="$ctrl.points.energy"></ma-point-value>
</md-card-content>
</md-card>
</div>
hvac.css
...
hvac-kpi-indicators div md-card md-card-content p {
    margin: 0;
    font-size: 1.25rem;
    font-weight: 700;
    color: var(--ma-accent);
    text-transform: uppercase;
}
hvac-kpi-indicators div md-card md-card-content span {
color: var(--ma-primary-700);
}
...
Don't forget to pass the units-count parameter to the component:
overview.html
<div layout="row" layout-wrap layout-align="space-between start">
<div flex="100" flex-gt-sm="50" flex-gt-md="60">
<hvac-kpi-indicators units-count="$ctrl.units.length"></hvac-kpi-indicators>
<md-card>
<md-card-header>
<p md-colors="::{color: 'accent'}">Active Alarms</p>
</md-card-header>
<md-card-content>
<hvac-map units="$ctrl.units" on-select-unit="$ctrl.onSelectUnit(unit)"></hvac-map>
</md-card-content>
</md-card>
<hvac-selected-unit-card ng-if="$ctrl.selectedUnit" unit="$ctrl.selectedUnit"></hvac-selected-unit-card>
</div>
<div flex="100" flex-gt-sm="50" flex-gt-md="40">
<md-card>
<md-card-header>
<p md-colors="::{color: 'accent'}">Units</p>
</md-card-header>
<md-card-content>
<hvac-units-table units="$ctrl.units"></hvac-units-table>
</md-card-content>
</md-card>
</div>
</div>
Reload the page, and you will see something like this: