It's possible you might run into an issue where something on your page is not working as expected or there is a clear issue. Since Mango leverages all the wonderful tools of modern web development you have great power at your fingertips to investigate and resolve.
In this example, the user entered a bad label expression in the HTML which caused the page to not render and displayed just a blank screen.

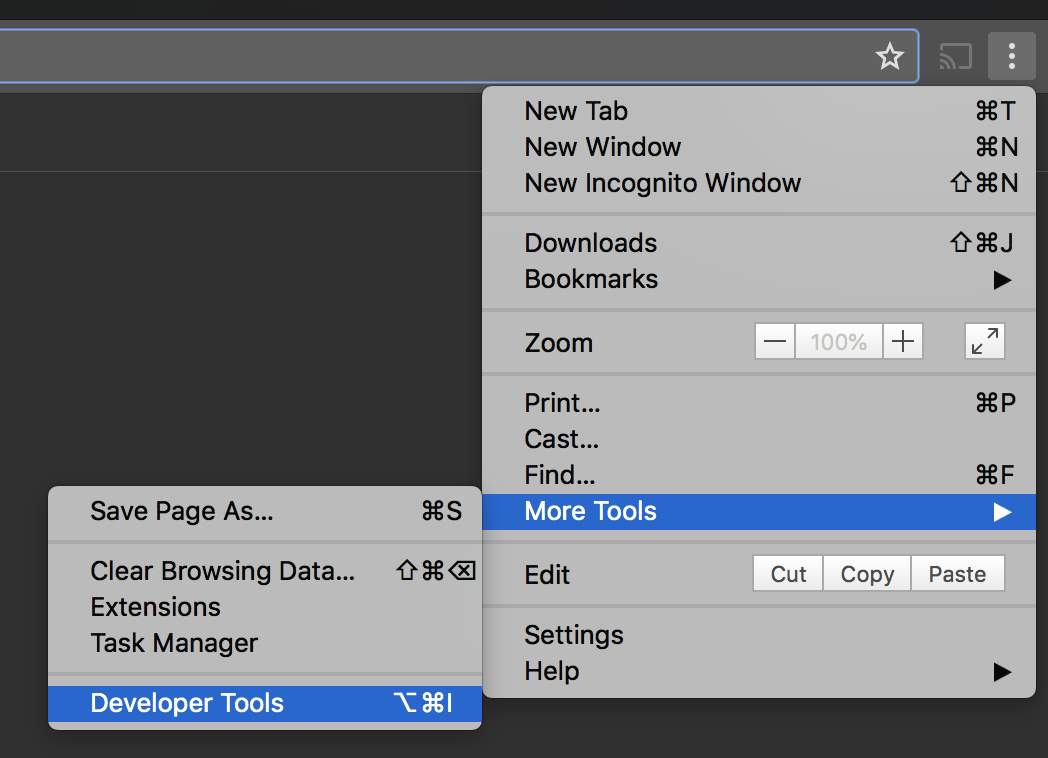
The first step is to open up Chrome Developer tools (requires using the Chrome browser).
Next look for an error that relates to something in your code. Here we can see the error with the label express.

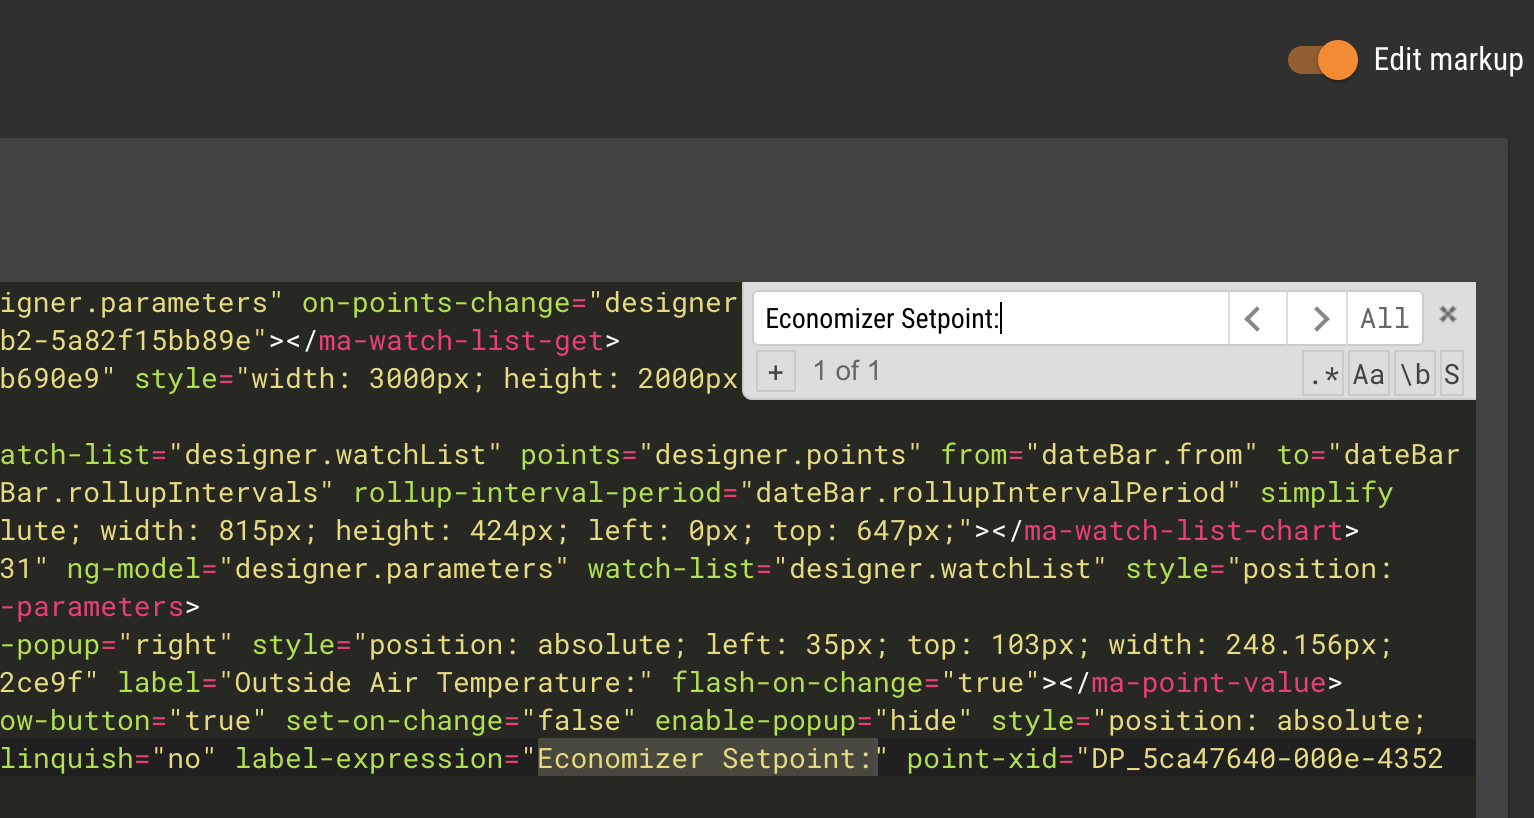
Using the Edit Markup option allows us to view the raw code. Ctr or Command F opens the search box and we can search our code for the value in the errors.

Now removing the label expression we can then switch back to preview mode and our screen works correctly. In some cases, you will need to do a browser refresh to make sure the issue is resolved.
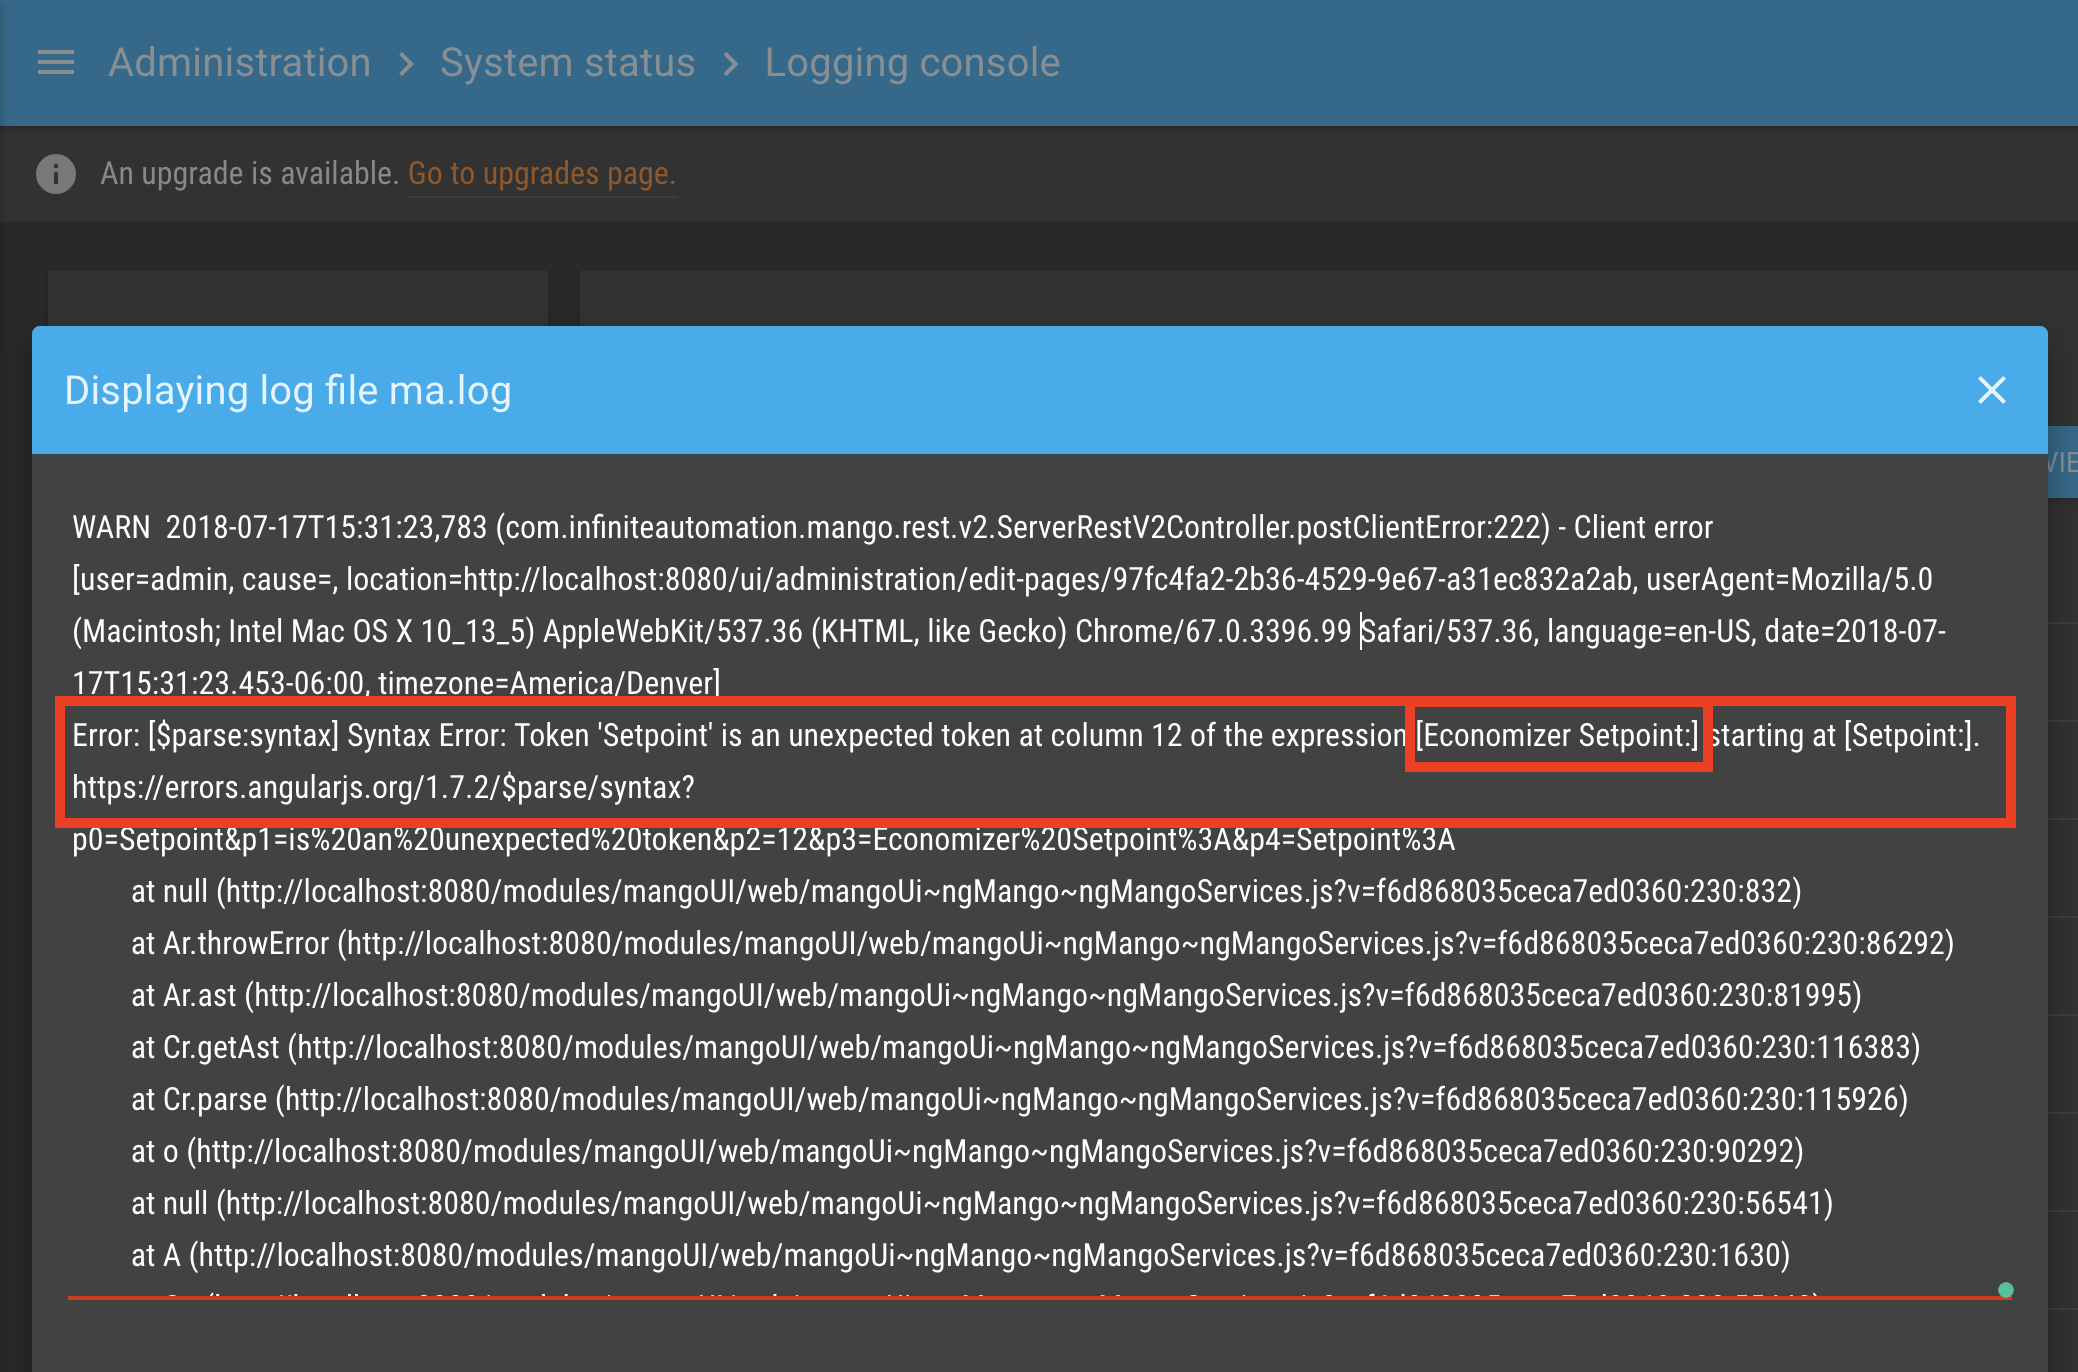
It's also helpful to know that browser errors are also captured into the Mango log file. If we open Administration > System Status and click View Current ma.log file we will see the same error.
