This is the 7th article of a Dashboard development series. You can check all the articles by clicking here
In this article, we are going to build the next chart component:
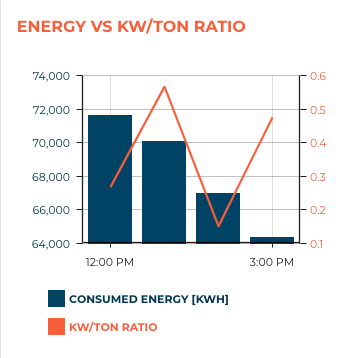
This component shows the total consumed energy as a bar chart and the kW/ton ratio as a line chart. Let's start by creating the energyChart.js and energyChart.html files in the components/energyChart directory:
energyChart.js
/**
 * @copyright 2020 {@link http://infiniteautomation.com|Infinite Automation Systems, Inc.} All rights reserved.
 * @author Luis Güette
 */
define(['angular', 'require'], (angular, require) => {
'use strict';
class EnergyChartController {
    static get $$ngIsClass() {
        return true;
    }

    static get $inject() {
        return [];
    }

    constructor() {

    }

    $onInit() {

    }
}

return {
    bindings: {

    },
    controller: EnergyChartController,
    templateUrl: require.toUrl('./energyChart.html')
};

});
energyChart.html
<h1>Energy chart</h1>
Then, we need to import it in hvac.js module:
hvac.js
/**
 * @copyright 2020 {@link http://infiniteautomation.com|Infinite Automation Systems, Inc.} All rights reserved.
 * @author Luis Güette
 */
define([
'angular',
'require',
'./pages/overview/overview.js',

'./components/map/map.js',
'./components/selectedUnitCard/selectedUnitCard.js',
'./components/unitsTable/unitsTable.js',
'./components/kpiIndicators/kpiIndicators.js',
'./components/energyChart/energyChart.js',

'./services/unit.js'

], (
angular,
require,
overview,
map,
selectedUnitCard,
unitsTable,
kpiIndicators,
energyChart,
unitService
) => {
'use strict';
const hvacModule = angular
    .module('hvacModule', ['maUiApp'])
    .component('hvacOverview', overview)
    .component('hvacMap', map)
    .component('hvacSelectedUnitCard', selectedUnitCard)
    .component('hvacUnitsTable', unitsTable)
    .component('hvacKpiIndicators', kpiIndicators)
    .component('hvacEnergyChart', energyChart)

    .factory('hvacUnit', unitService);

hvacModule.config([
    'maUiMenuProvider',
    (maUiMenuProvider) => {
        maUiMenuProvider.registerMenuItems([
            {
                name: 'ui.overview',
                url: '/overview',
                menuIcon: 'map',
                template: '<hvac-overview></hvac-overview>',
                menuText: 'Overview',
                weight: 100
            },
        ]);
    }
]);

return hvacModule;

}); // define
Let's call the hvac-energy-chart component in the overview.html file:
overview.html
<div layout="row" layout-wrap layout-align="space-between start">
<div flex="100" flex-gt-sm="50" flex-gt-md="60">
<hvac-kpi-indicators units-count="$ctrl.units.length"></hvac-kpi-indicators>
<md-card>
<md-card-header>
<p md-colors="::{color: 'accent'}">Active Alarms</p>
</md-card-header>
<md-card-content>
<hvac-map units="$ctrl.units" on-select-unit="$ctrl.onSelectUnit(unit)"></hvac-map>
</md-card-content>
</md-card>
<hvac-selected-unit-card ng-if="$ctrl.selectedUnit" unit="$ctrl.selectedUnit"></hvac-selected-unit-card>
</div>
<div flex="100" flex-gt-sm="50" flex-gt-md="40">
<div layout="row" layout-wrap layout-align="space-between stretch">
<md-card flex="100" flex-gt-md="45">
<md-card-content>
<hvac-energy-chart></hvac-energy-chart>
</md-card-content>
</md-card>
<md-card flex="100" flex-gt-md="45">
<md-card-content></md-card-content>
</md-card>
</div>
<md-card>
<md-card-header>
<p md-colors="::{color: 'accent'}">Units</p>
</md-card-header>
<md-card-content>
<hvac-units-table units="$ctrl.units"></hvac-units-table>
</md-card-content>
</md-card>
</div>
</div>
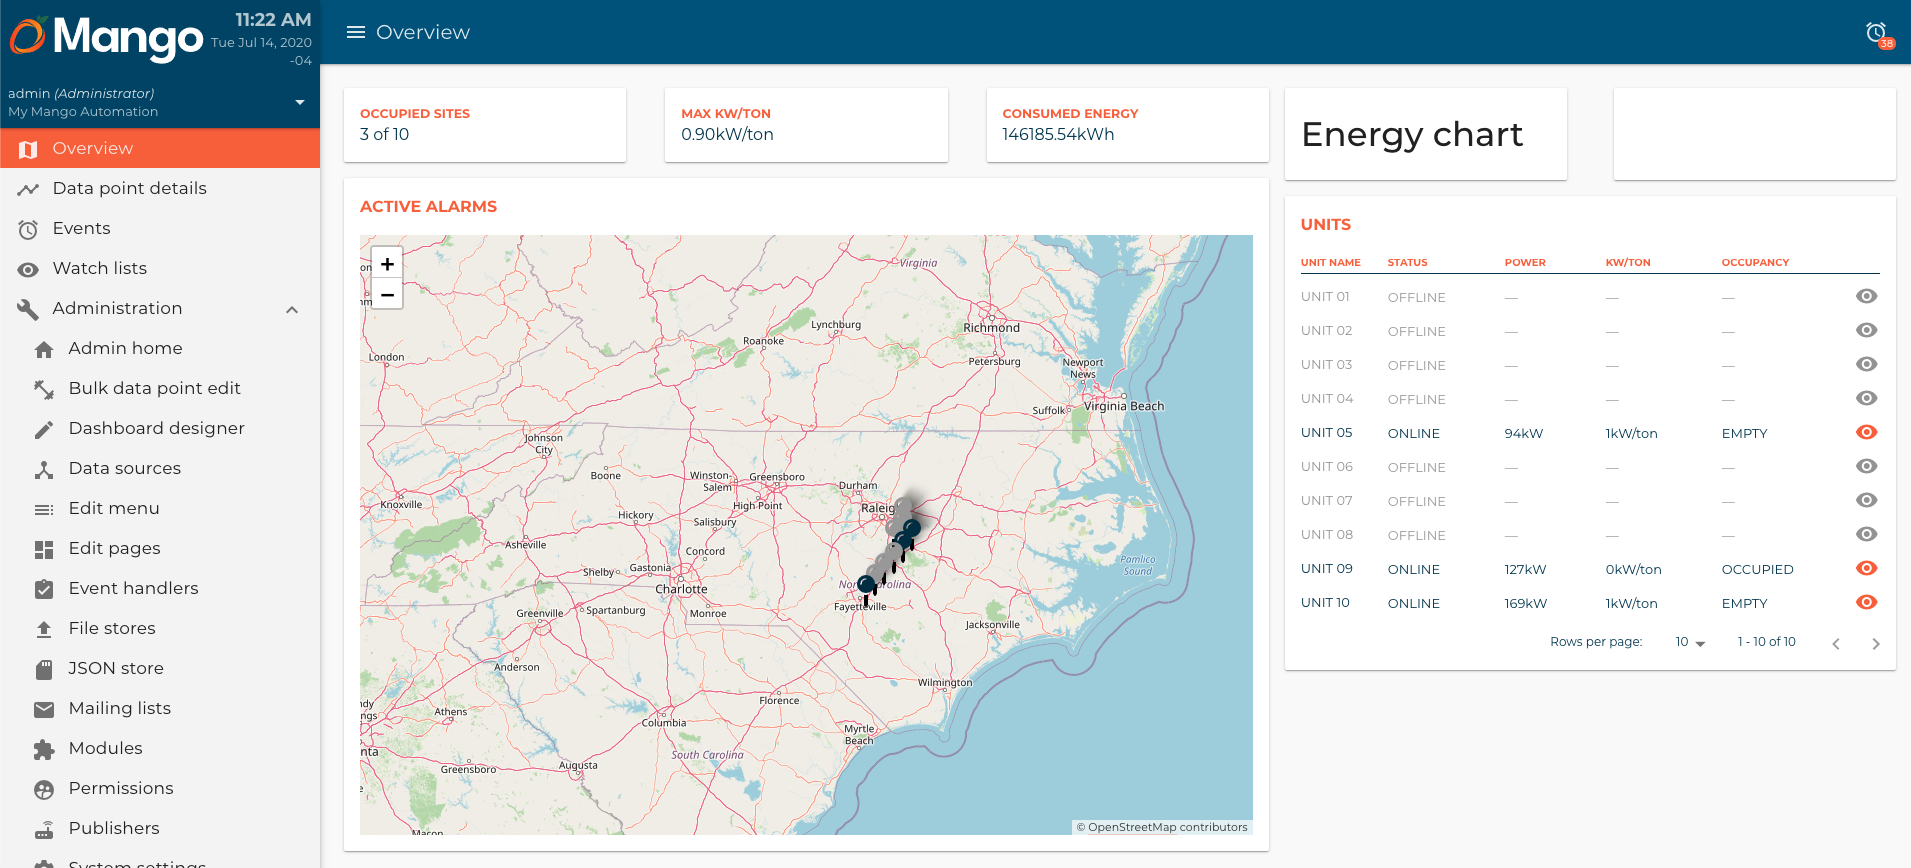
Reload the page, and you should see something like this:
Now, let's create a meta data point to store the kW/ton average from all the units. Go to the Data sources page and "General" meta data source, and create a meta data point:
For this data point, set the Name as kW/ton, and the Device name leave it as General.
Go to the Meta data point tab, set the Data type as Numeric, and the Variable name as maxKwTon.
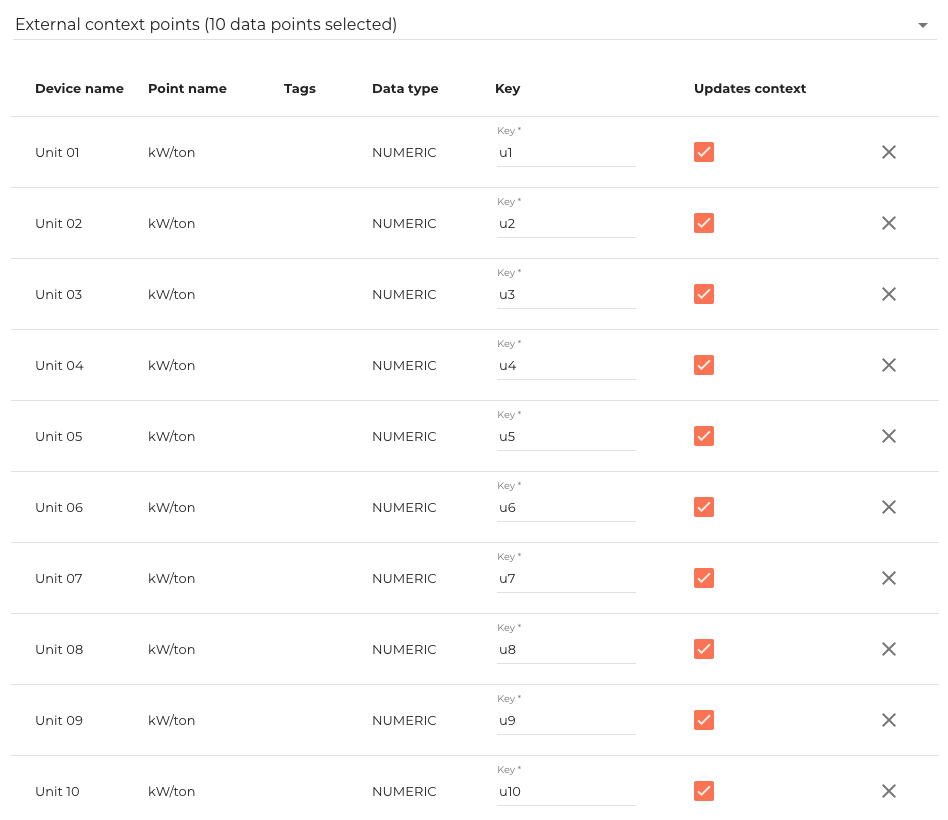
In the External context points, add all the unit kW/ton ratios like this:
In the Sctript section, add the next code:
var values = [u1.value, u2.value, u3.value, u4.value, u5.value, u6.value, u7.value, u8.value, u9.value, u10.value];
var count = values.length;
values = values.reduce(function (prev, current) { return current += prev });
return values/count;
Now, set the Context event type as Change so it updates only when one of the context points change its value.
Finally, go to the Text renderer properties and set the Suffix as kW/ton. Click Save.
Now that we have the data points. Let's get them in the energychart component.
energyChart.js
/**
 * @copyright 2020 {@link http://infiniteautomation.com|Infinite Automation Systems, Inc.} All rights reserved.
 * @author Luis Güette
 */
define(['angular', 'require'], (angular, require) => {
'use strict';
const POINT_KEYS = {
    'kW/ton': 'kwTon',
    'Consumed Energy': 'energy',
}

class EnergyChartController {
    static get $$ngIsClass() {
        return true;
    }

    static get $inject() {
        return ['maPoint', 'maUiDateBar'];
    }

    constructor(Point, DateBar) {
        this.Point = Point;
        this.DateBar = DateBar;
    }

    $onInit() {
        this.Point
            .buildQuery()
            .eq('deviceName', 'General')
            .or()
            .eq('name', 'Consumed Energy')
            .eq('name', 'kW/ton')
            .limit(1000)
            .query()
            .then(points => {
                this.points = {}

                points.forEach(point => {
                    this.points[POINT_KEYS[point.name]] = point
                });
            });
    }
}

return {
    bindings: {

    },
    controller: EnergyChartController,
    templateUrl: require.toUrl('./energyChart.html')
};

});
Then, we update the energyChart.html and add some styles in hvac.css:
energyChart.html
<ma-point-values
        point="$ctrl.points.energy"
        values="$ctrl.energyValues"
        rendered="true"
        from="$ctrl.DateBar.from"
        to="$ctrl.DateBar.to"
        rollup="DELTA"
        rollup-interval="1 HOURS"
></ma-point-values>
<ma-point-values
point="$ctrl.points.kwTon"
values="$ctrl.kwTonValues"
rendered="true"
from="$ctrl.DateBar.from"
to="$ctrl.DateBar.to"
rollup="AVERAGE"
rollup-interval="1 HOURS"
></ma-point-values>
<ma-serial-chart
style="height: 300px; width: 100%"
series-1-point="$ctrl.points.energy"
series-1-values="$ctrl.energyValues"
series-1-type="column"
series-1-axis="left"
series-1-title="Consumed Energy [kWh]"
series-1-graph-options="{fillAlphas: 1}"
series-2-point="$ctrl.points.kwTon"
series-2-values="$ctrl.kwTonValues"
series-2-type="line"
series-2-axis="right"
series-2-title="kW/ton ratio"
legend="true"
options="{
'legend' : {
align: 'center',
},
}"
></ma-serial-chart>
ma-point-valuesreturns an array based on the time window and rollups.- We pass the
$ctrl.energyValuesand$ctrl.kwTonValuestoma-serial-chart. ma-serial-chartdirective allows you to create line and bar charts.
You can find more information about these directives in the Mango API docs section.
hvac.css
...
hvac-energy-chart .value-axis-left .amcharts-axis-label {
    color: var(--ma-primary-700);
}
hvac-energy-chart .value-axis-right .amcharts-axis-label {
color: var(--ma-accent);
}
hvac-energy-chart .amcharts-legend-label {
text-transform: uppercase;
font-weight: 700;
}
hvac-energy-chart .amcharts-legend-item-series-1 .amcharts-legend-label {
color: var(--ma-primary-700);
}
hvac-energy-chart .amcharts-legend-item-series-2 .amcharts-legend-label {
color: var(--ma-accent);
}
...
Now, let's update the overview.html as the chart needs a little bit more space:
overview.html
<div class="left-container" layout="row" layout-wrap layout-align="space-between start">
<div flex="100" flex-gt-sm="50" flex-gt-md="60">
<hvac-kpi-indicators units-count="$ctrl.units.length"></hvac-kpi-indicators>
<md-card>
<md-card-header>
<p md-colors="::{color: 'accent'}">Active Alarms</p>
</md-card-header>
<md-card-content>
<hvac-map units="$ctrl.units" on-select-unit="$ctrl.onSelectUnit(unit)"></hvac-map>
</md-card-content>
</md-card>
<hvac-selected-unit-card ng-if="$ctrl.selectedUnit" unit="$ctrl.selectedUnit"></hvac-selected-unit-card>
</div>
<div class="right-container" flex="100" flex-gt-sm="50" flex-gt-md="40">
<div layout="row" layout-wrap layout-align="space-between stretch">
<div class="energy-chart-container" flex="100" flex-gt-md="60">
<md-card>
<md-card-header>
<p md-colors="::{color: 'accent'}">Energy vs kW/ton ratio</p>
</md-card-header>
<md-card-content>
<hvac-energy-chart></hvac-energy-chart>
</md-card-content>
</md-card>
</div>
<div class="alarms-list-container" flex="100" flex-gt-md="40">
<md-card flex="100">
<md-card-content></md-card-content>
</md-card>
</div>
</div>
<md-card>
<md-card-header>
<p md-colors="::{color: 'accent'}">Units</p>
</md-card-header>
<md-card-content>
<hvac-units-table units="$ctrl.units"></hvac-units-table>
</md-card-content>
</md-card>
</div>
</div>
hvac.css
...
hvac-overview .right-container .energy-chart-container,
hvac-overview .right-container .alarms-list-container {
    margin-bottom: 1rem;
}
hvac-overview .right-container .energy-chart-container md-card,
hvac-overview .right-container .alarms-list-container md-card {
height: 100%;
}
...
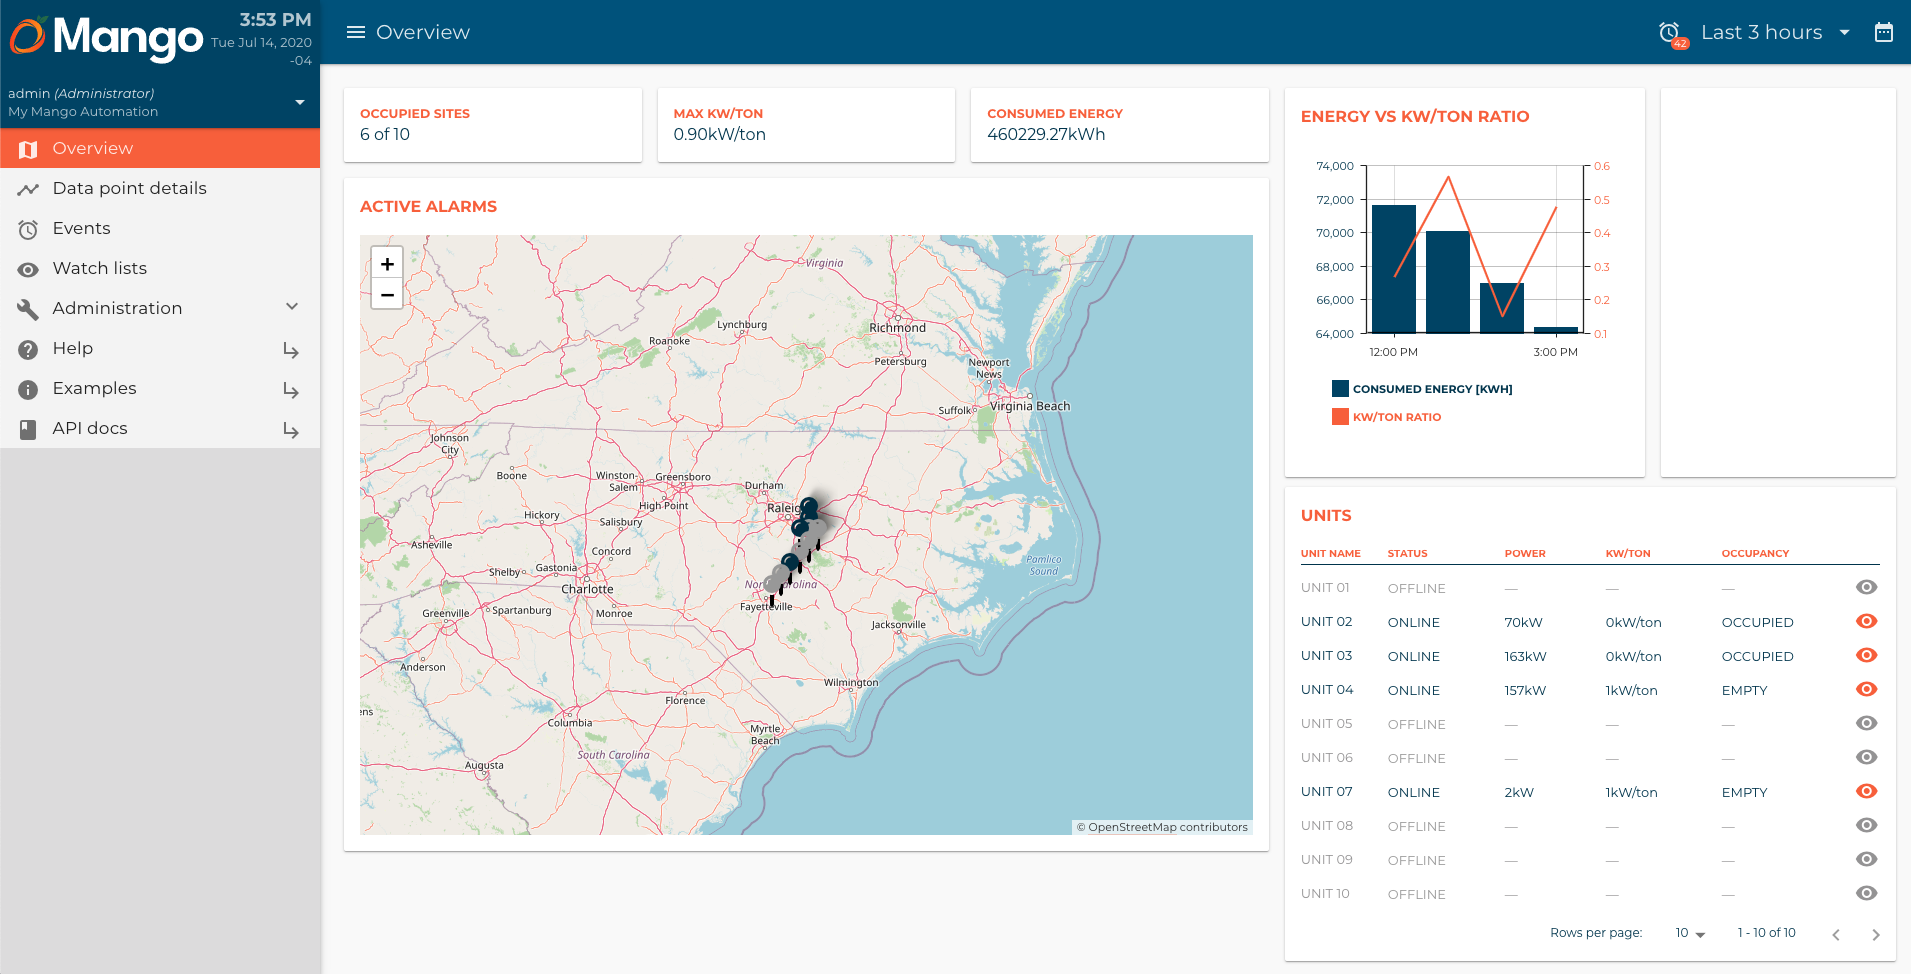
Reload the page and you should see something like this: